
Page 38 - Las Vegas LVQR Market Research Report Q1 2024
P. 38
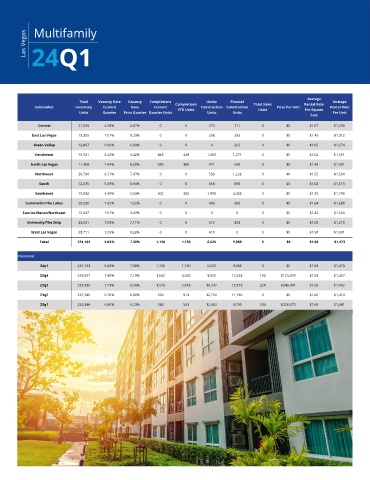
Multifamily
         Las Vegas  24Q1


                                                                                                       Average
                           Total   Vacancy Rate   Vacancy  Completions   Completions   Under   Planned   Total Sales   Rental Rate   Average
             Submarket    Inventory   Current   Rate  Current   YTD Units  Construction  Construction   Units  Price Per Unit  Per Square   Rental Rate
                           Units   Quarter  Prior Quarter Quarter Units  Units  Units                          Per Unit
                                                                                                        Foot
              Central      21,095   6.28%   6.87%     0       0       275      711      0       $0     $1.67    $1,238
            East Las Vegas  15,355  7.61%   8.29%     0       0       208      282      0       $0     $1.49    $1,312
            Green Valley   12,067   6.06%   6.48%     0       0        0       202      0       $0     $1.65    $1,574
             Henderson     19,721   6.42%   6.42%    448      448     1,005   1,271     0       $0     $1.62    $1,651
           North Las Vegas  11,488  7.44%   8.59%    380      380     471      540      0       $0     $1.49    $1,491
             Northwest     20,790   6.71%   7.47%     0       0       539     1,228     0       $0     $1.55    $1,500
              South        12,476   5.09%   5.94%     0       0       669      899      0       $0     $1.63    $1,619
             Southwest     19,932   6.40%   6.53%    302      302     1,890   3,302     0       $0     $1.70    $1,706
         Summerlin/The Lakes  20,550  7.42%  7.52%    0       0       486      300      0       $0     $1.64    $1,688
         Sunrise Manor/Northeast  15,437  7.61%  9.02%  0     0        0       0        0       $0     $1.42    $1,260
          University/The Strip  33,541  7.09%  7.11%  0       0       672      353      0       $0     $1.50    $1,218
           West Las Vegas  28,711   7.26%   8.22%     0       0       410      0        0       $0     $1.58    $1,331
              Total        231,163  6.84%   7.38%    1,130   1,130    6,625   9,088     0       $0     $1.58    $1,473

       Historical
              24q1         231,163  6.84%   7.38%    1,130   1,130    6,625   9,088     0       $0     $1.58    $1,473
              23q4         229,057  7.38%   7.19%    1,542   4,025    9,655   12,523   192    $174,479  $1.58   $1,467
              23q3         228,396  7.19%   6.76%    1,570   2,483   10,737   12,818   228    $346,491  $1.59   $1,462
              23q2         227,280  6.76%   6.80%    569      913    12,756   11,785    0       $0     $1.60    $1,474
              23q1         226,388  6.80%   6.23%    543      543    12,492   9,795    504    $228,373  $1.60   $1,481