
Page 91 - Airplane Flying Handbook
P. 91
Additional Role for the Elevator
On the front side of the power required curve, where the airplane cruises at high speed (1 in Figure 4-4) and a low angle of attack
(AOA) with little or no excess power or excess thrust (A in Figure 4-4), pulling back on the yoke or stick (elevator up) will result in a
brief energy exchange climb, causing the airplane to slow down from 1 to 2 toward the center of the power curve [Figure 4-4]. This
decrease in airspeed results in a reduction in total drag; hence available energy in the form of positive excess power (P S > 0) where
thrust exceeds drag (T – D > 0). With this excess power (B in Figure 4-4) the airplane can now climb at a constant airspeed or turn in
level flight while maintaining a constant airspeed at an increased load factor.
On the backside of the power required curve, where the airplane flies at low speed (3 in Figure 4-4) and high AOA with little or no
excess power or excess thrust (C in Figure 4-4), pushing forward on the yoke or stick (elevator down) will result in a brief energy
exchange descent, causing the airplane to accelerate from 3 to 2 toward the center of the power curve [Figure 4-4]. This increase in
airspeed results in a reduction in total drag; hence available energy in the form of positive excess power (P S >0) where thrust exceeds
drag (T – D > 0). With this excess power (B in Figure 4-4) the airplane can now climb at a constant airspeed or turn in level flight
while maintaining a constant airspeed at an increased load factor. This role of the elevator is critical to prevent unintentional,
excessive deceleration or sink rate as illustrated later in the chapter (refer to Preventing Irreversible Deceleration and/or Sink Rate
section).
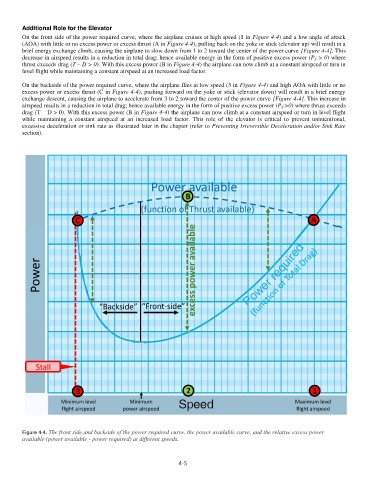
Figure 4-4. The front side and backside of the power required curve, the power available curve, and the relative excess power
available (power available - power required) at different speeds.
4-5