
Page 94 - Airplane Flying Handbook
P. 94
Since the total specific energy, E S , has the units of height (e.g., feet), it is usually called energy height. It also gets this name from the
fact that energy height is the maximum height that an airplane would reach from its current altitude, if it were to trade all its speed for
altitude. Figure 4-6 shows lines of constant total specific energy or energy height. Different positions of an airplane along a given
energy height line have the same total energy regardless of their location on the line (e.g., A and B).
Thus, even though the airplane in point A is cruising at 100 knots and 6,000 feet, it has the same total specific energy expressed in
B, would
height (6,500 feet) when cruising at 240 knots and 4,000 feet (B). This also means that the airplane in either position, A or
be able to “zoom” to the same maximum altitude of 6,500 feet by trading all its speed for altitude. The lines of constant energy height
can be used as idealized trajectories to depict an airplane moving from one energy state to another solely through energy
exchange (e.g., A to B). If the airplane rapidly exchanges altitude and airspeed, it would follow along the energy height line while, in
the short term, maintaining constant total energy.
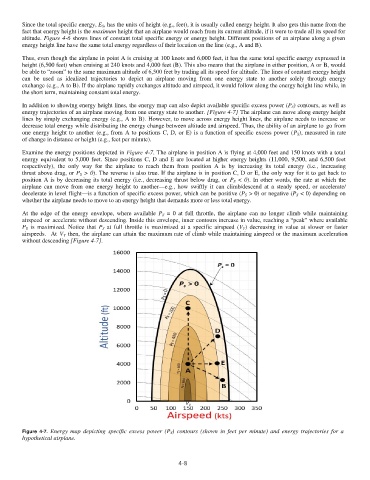
In addition to showing energy height lines, the energy map can also depict available specific excess power (P S ) contours, as well as
energy trajectories of an airplane moving from one energy state to another. [Figure 4-7] The airplane can move along energy height
lines by simply exchanging energy (e.g., A to B). However, to move across energy height lines, the airplane needs to increase or
decrease total energy while distributing the energy change between altitude and airspeed. Thus, the ability of an airplane to go from
one energy height to another (e.g., from A to positions C, D, or E) is a function of specific excess power (P S ), measured in rate
of change in distance or height (e.g., feet per minute).
Examine the energy positions depicted in Figure 4-7. The airplane in position A is flying at 4,000 feet and 150 knots with a total
energy equivalent to 5,000 feet. Since positions C, D and E are located at higher energy heights (11,000, 9,500, and 6,500 feet
respectively), the only way for the airplane to reach them from position A is by increasing its total energy (i.e., increasing
thrust above drag, or P S > 0). The reverse is also true. If the airplane is in position C, D or E, the only way for it to get back to
position A is by decreasing its total energy (i.e., decreasing thrust below drag, or P S < 0). In other words, the rate at which the
airplane can move from one energy height to another—e.g., how swiftly it can climb/descend at a steady speed, or accelerate/
decelerate in level flight—is a function of specific excess power, which can be positive (P S > 0) or negative (P S < 0) depending on
whether the airplane needs to move to an energy height that demands more or less total energy.
At the edge of the energy envelope, where available P S = 0 at full throttle, the airplane can no longer climb while maintaining
airspeed or accelerate without descending. Inside this envelope, inner contours increase in value, reaching a “peak” where available
P S is maximized. Notice that P S at full throttle is maximized at a specific airspeed (V Y ) decreasing in value at slower or faster
airspeeds. At V Y then, the airplane can attain the maximum rate of climb while maintaining airspeed or the maximum acceleration
without descending [Figure 4-7].
Figure 4-7. Energy map depicting specific excess power (P S ) contours (shown in feet per minute) and energy trajectories for a
hypothetical airplane.
4-8