
Page 95 - Airplane Flying Handbook
P. 95
Three Basic Rules of Energy Control
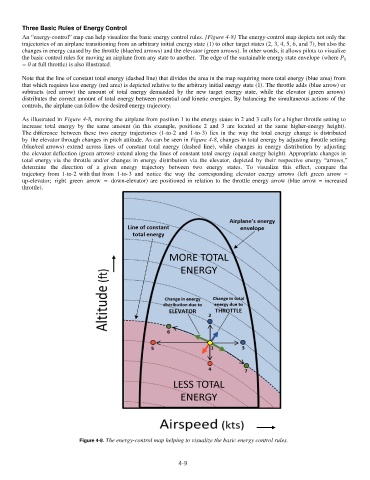
An “energy-control” map can help visualize the basic energy control rules. [Figure 4-8] The energy-control map depicts not only the
airplane transitioning from an arbitrary initial energy state (1) to other target states (2, 3, 4, 5, 6, and 7), but also the
trajectories of an
changes in energy caused by the throttle (blue/red arrows) and the elevator (green arrows). In other words, it allows pilots to visualize
the basic control rules for moving an airplane from any state to another. The edge of the sustainable energy state envelope (where P S
= 0 at full throttle) is also illustrated.
Note that the line of constant total energy (dashed line) that divides the area in the map requiring more total energy (blue area) from
that which requires less energy (red area) is depicted relative to the arbitrary initial energy state (1). The throttle adds (blue arrow) or
subtracts (red arrow) the amount of total energy demanded by the new target energy state, while the elevator (green arrows)
distributes the correct amount of total energy between potential and kinetic energies. By balancing the simultaneous actions of the
controls, the airplane can follow the desired energy trajectory.
As illustrated in Figure 4-8, moving the airplane from position 1 to the energy states in 2 and 3 calls for a higher throttle setting to
increase total energy by the same amount (in this example, positions 2 and 3 are located at the same higher-energy height).
The difference between these two energy trajectories (1-to-2 and 1-to-3) lies in the way the total energy change is distributed
by the elevator through changes in pitch attitude. As can be seen in Figure 4-8, changes in total energy by adjusting throttle setting
(blue/red arrows) extend across lines of constant total energy (dashed line), while changes in energy distribution by adjusting
the elevator deflection (green arrows) extend along the lines of constant total energy (equal energy height). Appropriate changes in
total energy via the throttle and/or changes in energy distribution via the elevator, depicted by their respective energy “arrows,”
determine the direction of a given energy trajectory between two energy states. To visualize this effect, compare the
trajectory from 1-to-2 with that from 1-to-3 and notice the way the corresponding elevator energy arrows (left green arrow =
up-elevator; right green arrow = down-elevator) are positioned in relation to the throttle energy arrow (blue arrow = increased
throttle).
Figure 4-8. The energy-control map helping to visualize the basic energy control rules.
4-9