
Page 85 - 2019-20 CAFR
P. 85
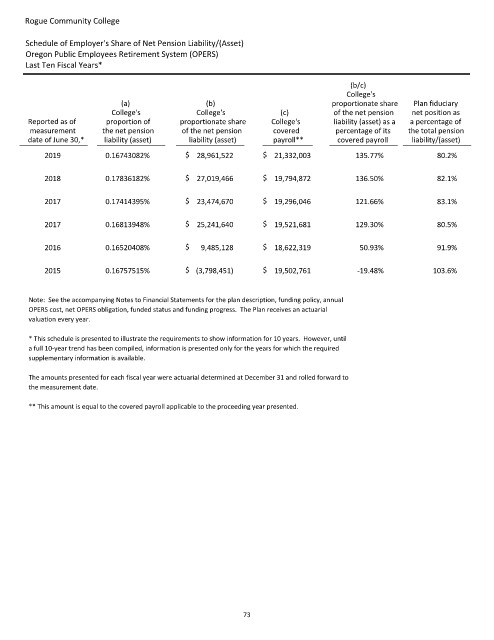
Rogue Community College
Schedule of Employer's Share of Net Pension Liability/(Asset)
Oregon Public Employees Retirement System (OPERS)
Last Ten Fiscal Years*
(b/c)
College's
(a) (b) proportionate share Plan fiduciary
College's College's (c) of the net pension net position as
Reported as of proportion of proportionate share College's liability (asset) as a a percentage of
measurement the net pension of the net pension covered percentage of its the total pension
date of June 30,* liability (asset) liability (asset) payroll** covered payroll liability/(asset)
2019 0.16743082% $ 28,961,522 $ 21,332,003 135.77% 80.2%
2018 0.17836182% $ 27,019,466 $ 19,794,872 136.50% 82.1%
2017 0.17414395% $ 23,474,670 $ 19,296,046 121.66% 83.1%
2017 0.16813948% $ 25,241,640 $ 19,521,681 129.30% 80.5%
2016 0.16520408% $ 9,485,128 $ 18,622,319 50.93% 91.9%
2015 0.16757515% $ (3,798,451) $ 19,502,761 19.48% 103.6%
Note: See the accompanying Notes to Financial Statements for the plan description, funding policy, annual
OPERS cost, net OPERS obligation, funded status and funding progress. The Plan receives an actuarial
valuation every year.
* This schedule is presented to illustrate the requirements to show information for 10 years. However, until
a full 10year trend has been compiled, information is presented only for the years for which the required
supplementary information is available.
The amounts presented for each fiscal year were actuarial determined at December 31 and rolled forward to
the measurement date.
** This amount is equal to the covered payroll applicable to the proceeding year presented.
73