
Page 844 - Mechatronics with Experiments
P. 844
830 MECHATRONICS
z1= x1 .∗ exp(-x1.ˆ2 - y1.ˆ2) ;
figure(1)
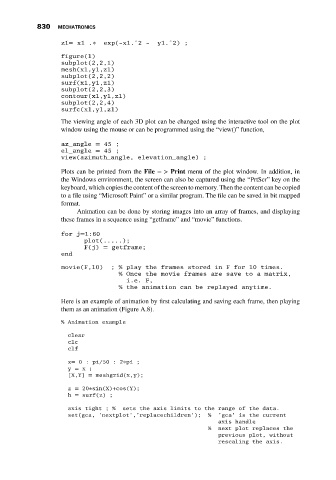
subplot(2,2,1)
mesh(x1,y1,z1)
subplot(2,2,2)
surf(x1,y1,z1)
subplot(2,2,3)
contour(x1,y1,z1)
subplot(2,2,4)
surfc(x1,y1,z1)
The viewing angle of each 3D plot can be changed using the interactive tool on the plot
window using the mouse or can be programmed using the “view()” function,
az_angle = 45 ;
el_angle = 45 ;
view(azimuth_angle, elevation_angle) ;
Plots can be printed from the File − > Print menu of the plot window. In addition, in
the Windows environment, the screen can also be captured using the “PrtScr” key on the
keyboard, which copies the content of the screen to memory. Then the content can be copied
to a file using “Microsoft Paint” or a similar program. The file can be saved in bit mapped
format.
Animation can be done by storing images into an array of frames, and displaying
these frames in a sequence using “getframe” and “movie” functions.
for j=1:60
plot(.....);
F(j) = getframe;
end
movie(F,10) ; % play the frames stored in F for 10 times.
% Once the movie frames are save to a matrix,
i.e. F,
% the animation can be replayed anytime.
Here is an example of animation by first calculating and saving each frame, then playing
them as an animation (Figure A.8).
% Animation example
clear
clc
clf
x= 0 : pi/50 : 2∗pi ;
y = x;
[X,Y] = meshgrid(x,y);
z = 20∗sin(X)+cos(Y);
h = surf(z) ;
axis tight ; % sets the axis limits to the range of the data.
set(gca, ’nextplot’,’replacechildren’); % ’gca’ is the current
axis handle
% next plot replaces the
previous plot, without
rescaling the axis.