
Page 415 - Microeconomics, Fourth Edition
P. 415
c10competitive markets applications.qxd 7/15/10 4:58 PM Page 389
10.1 THE INVISIBLE HAND, EXCISE TAXES, AND SUBSIDIES 389
THE INVISIBLE HAND
One of the remarkable features of a perfectly competitive market is this: In equilib-
rium, a competitive market allocates resources efficiently. Figure 10.1 illustrates this
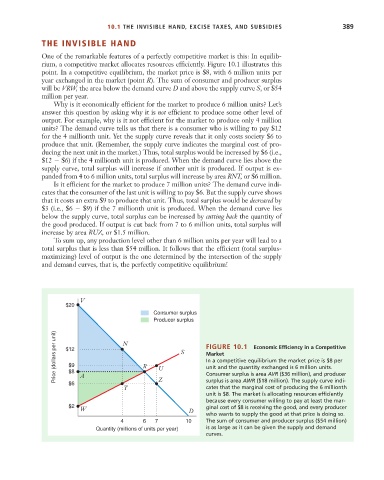
point. In a competitive equilibrium, the market price is $8, with 6 million units per
year exchanged in the market (point R). The sum of consumer and producer surplus
will be VRW, the area below the demand curve D and above the supply curve S, or $54
million per year.
Why is it economically efficient for the market to produce 6 million units? Let’s
answer this question by asking why it is not efficient to produce some other level of
output. For example, why is it not efficient for the market to produce only 4 million
units? The demand curve tells us that there is a consumer who is willing to pay $12
for the 4 millionth unit. Yet the supply curve reveals that it only costs society $6 to
produce that unit. (Remember, the supply curve indicates the marginal cost of pro-
ducing the next unit in the market.) Thus, total surplus would be increased by $6 (i.e.,
$12 $6) if the 4 millionth unit is produced. When the demand curve lies above the
supply curve, total surplus will increase if another unit is produced. If output is ex-
panded from 4 to 6 million units, total surplus will increase by area RNT, or $6 million.
Is it efficient for the market to produce 7 million units? The demand curve indi-
cates that the consumer of the last unit is willing to pay $6. But the supply curve shows
that it costs an extra $9 to produce that unit. Thus, total surplus would be decreased by
$3 (i.e., $6 $9) if the 7 millionth unit is produced. When the demand curve lies
below the supply curve, total surplus can be increased by cutting back the quantity of
the good produced. If output is cut back from 7 to 6 million units, total surplus will
increase by area RUZ, or $1.5 million.
To sum up, any production level other than 6 million units per year will lead to a
total surplus that is less than $54 million. It follows that the efficient (total surplus-
maximizing) level of output is the one determined by the intersection of the supply
and demand curves, that is, the perfectly competitive equilibrium!
V
$20
Consumer surplus
Producer surplus
Price (dollars per unit) $12 N R U S FIGURE 10.1 Economic Efficiency in a Competitive
Market
In a competitive equilibrium the market price is $8 per
$9
unit and the quantity exchanged is 6 million units.
$8
Consumer surplus is area AVR ($36 million), and producer
surplus is area AWR ($18 million). The supply curve indi-
A
$6
Z
cates that the marginal cost of producing the 6 millionth
T
unit is $8. The market is allocating resources efficiently
because every consumer willing to pay at least the mar-
$2 ginal cost of $8 is receiving the good, and every producer
who wants to supply the good at that price is doing so.
W
D
4 6 7 10 The sum of consumer and producer surplus ($54 million)
Quantity (millions of units per year) is as large as it can be given the supply and demand
curves.