
Page 443 - Microeconomics, Fourth Edition
P. 443
c10competitive markets applications.qxd 7/15/10 4:58 PM Page 417
10.4 PRICE SUPPORTS IN THE AGRICULTURAL SECTOR 417
LEARNING-BY-DOING EXERCISE 10.5
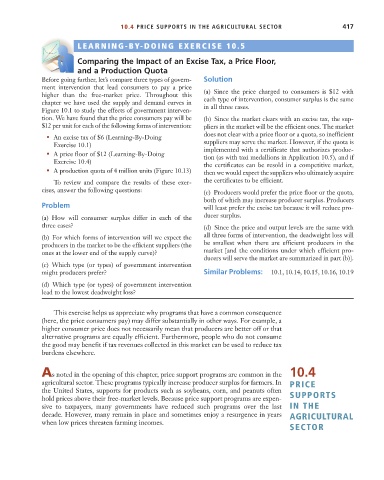
S
D
E
Comparing the Impact of an Excise Tax, a Price Floor,
and a Production Quota
Before going further, let’s compare three types of govern- Solution
ment intervention that lead consumers to pay a price
higher than the free-market price. Throughout this (a) Since the price charged to consumers is $12 with
chapter we have used the supply and demand curves in each type of intervention, consumer surplus is the same
Figure 10.1 to study the effects of government interven- in all three cases.
tion. We have found that the price consumers pay will be (b) Since the market clears with an excise tax, the sup-
$12 per unit for each of the following forms of intervention: pliers in the market will be the efficient ones. The market
does not clear with a price floor or a quota, so inefficient
• An excise tax of $6 (Learning-By-Doing
Exercise 10.1) suppliers may serve the market. However, if the quota is
implemented with a certificate that authorizes produc-
• A price floor of $12 (Learning-By-Doing tion (as with taxi medallions in Application 10.5), and if
Exercise 10.4)
the certificates can be resold in a competitive market,
• A production quota of 4 million units (Figure 10.13) then we would expect the suppliers who ultimately acquire
To review and compare the results of these exer- the certificates to be efficient.
cises, answer the following questions: (c) Producers would prefer the price floor or the quota,
both of which may increase producer surplus. Producers
Problem will least prefer the excise tax because it will reduce pro-
(a) How will consumer surplus differ in each of the ducer surplus.
three cases? (d) Since the price and output levels are the same with
(b) For which forms of intervention will we expect the all three forms of intervention, the deadweight loss will
producers in the market to be the efficient suppliers (the be smallest when there are efficient producers in the
ones at the lower end of the supply curve)? market [and the conditions under which efficient pro-
ducers will serve the market are summarized in part (b)].
(c) Which type (or types) of government intervention
might producers prefer? Similar Problems: 10.1, 10.14, 10.15, 10.16, 10.19
(d) Which type (or types) of government intervention
lead to the lowest deadweight loss?
This exercise helps us appreciate why programs that have a common consequence
(here, the price consumers pay) may differ substantially in other ways. For example, a
higher consumer price does not necessarily mean that producers are better off or that
alternative programs are equally efficient. Furthermore, people who do not consume
the good may benefit if tax revenues collected in this market can be used to reduce tax
burdens elsewhere.
As noted in the opening of this chapter, price support programs are common in the 10.4
agricultural sector. These programs typically increase producer surplus for farmers. In PRICE
the United States, supports for products such as soybeans, corn, and peanuts often
hold prices above their free-market levels. Because price support programs are expen- SUPPORTS
sive to taxpayers, many governments have reduced such programs over the last IN THE
decade. However, many remain in place and sometimes enjoy a resurgence in years AGRICULTURAL
when low prices threaten farming incomes.
SECTOR