
Page 439 - Microeconomics, Fourth Edition
P. 439
c10competitive markets applications.qxd 7/15/10 4:58 PM Page 413
10.3 PRODUCTION QUOTAS 413
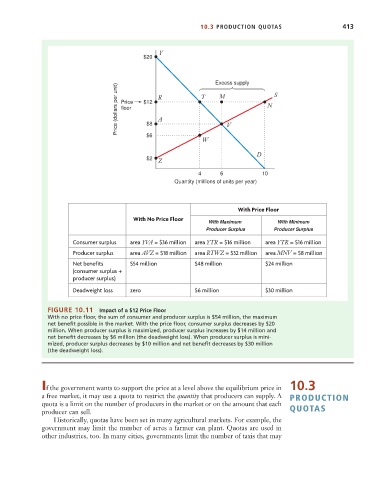
$20 Y
Excess supply
Price (dollars per unit) Price $12 R T M N S
floor
A
$8
$6
W V
$2 D
Z
4 6 10
Quantity (millions of units per year)
With Price Floor
With No Price Floor
W ith Maximum With Minimum
Producer Surplus Producer Surplus
C onsumer surplus area YVA = $36 million area YTR = $16 million area YTR = $16 million
Producer surplus area AVZ = $18 million area R TWZ = $32 million area MNV = $8 million
Net benefits $54 million $48 million $24 million
(c onsumer surplus +
producer surplus)
Deadweight loss zero $6 million $30 million
FIGURE 10.11 Impact of a $12 Price Floor
With no price floor, the sum of consumer and producer surplus is $54 million, the maximum
net benefit possible in the market. With the price floor, consumer surplus decreases by $20
million. When producer surplus is maximized, producer surplus increases by $14 million and
net benefit decreases by $6 million (the deadweight loss). When producer surplus is mini-
mized, producer surplus decreases by $10 million and net benefit decreases by $30 million
(the deadweight loss).
If the government wants to support the price at a level above the equilibrium price in 10.3
a free market, it may use a quota to restrict the quantity that producers can supply. A PRODUCTION
quota is a limit on the number of producers in the market or on the amount that each
producer can sell. QUOTAS
Historically, quotas have been set in many agricultural markets. For example, the
government may limit the number of acres a farmer can plant. Quotas are used in
other industries, too. In many cities, governments limit the number of taxis that may