
Page 434 - Microeconomics, Fourth Edition
P. 434
c10competitive markets applications.qxd 7/15/10 4:58 PM Page 408
408 CHAPTER 10 COMPETITIVE MARKETS: APPLICATIONS
$20 Y
Price (dollars per unit) $14 A U T V Supply
$12
$8
Price
ceiling $6 S R W X
$2
Demand
Z
3 4 6 7 10
Quantity (millions of units per year)
With Price Ceiling
With No Price W ith Maximum With Minimum
C eiling Consumer Surplus Consumer Surplus
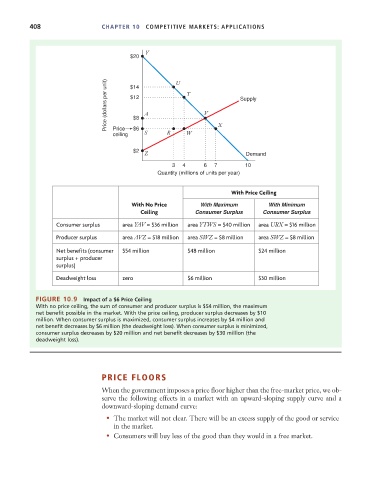
C onsumer surplus area YAV = $36 million area YTWS = $40 million area URX = $16 million
Producer surplus area AVZ = $18 million area SWZ = $8 million area SWZ = $8 million
Net benefits (consumer $54 million $48 million $24 million
surplus + producer
surplus)
Deadweight loss zero $6 million $30 million
FIGURE 10.9 Impact of a $6 Price Ceiling
With no price ceiling, the sum of consumer and producer surplus is $54 million, the maximum
net benefit possible in the market. With the price ceiling, producer surplus decreases by $10
million. When consumer surplus is maximized, consumer surplus increases by $4 million and
net benefit decreases by $6 million (the deadweight loss). When consumer surplus is minimized,
consumer surplus decreases by $20 million and net benefit decreases by $30 million (the
deadweight loss).
PRICE FLOORS
When the government imposes a price floor higher than the free-market price, we ob-
serve the following effects in a market with an upward-sloping supply curve and a
downward-sloping demand curve:
• The market will not clear. There will be an excess supply of the good or service
in the market.
• Consumers will buy less of the good than they would in a free market.