
Page 436 - Microeconomics, Fourth Edition
P. 436
c10competitive markets applications.qxd 7/15/10 4:58 PM Page 410
410 CHAPTER 10 COMPETITIVE MARKETS: APPLICATIONS
S
Y
w, wage rate (dollars per hour) w min = $6 A B E I R J G V T
C
w = $5
F
H
W
Z
35 X 80 100 115 D
Excess labor supply
L, quantity of labor
(millions of hours per year)
With Minimum Wage
Case 1 Case 2
Free Market (maximum (minimum Impact of Minimum Wage
( with no producer producer
minimum wage) surplus) surplus) Case 1 Case 2
C onsumer surplus A + B + C + E + F A + B A + B –C – E – F –C – E – F
Producer surplus H + I + J C + E + H + I E + F + G + I + J C + E – J E + F + G – H
Net benefits A + B + C + E + A + B + C + E + A + B + E + F + –F – J –C – H + G
(c onsumer surplus + F + H + I + J H + I G + I + J
producer surplus)
Deadweight loss zero F + J C + H – G F + J C + H – G
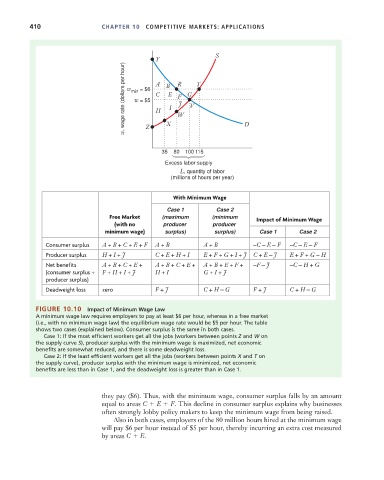
FIGURE 10.10 Impact of Minimum Wage Law
A minimum wage law requires employers to pay at least $6 per hour, whereas in a free market
(i.e., with no minimum wage law) the equilibrium wage rate would be $5 per hour. The table
shows two cases (explained below). Consumer surplus is the same in both cases.
Case 1: If the most efficient workers get all the jobs (workers between points Z and W on
the supply curve S), producer surplus with the minimum wage is maximized, net economic
benefits are somewhat reduced, and there is some deadweight loss.
Case 2: If the least efficient workers get all the jobs (workers between points X and T on
the supply curve), producer surplus with the minimum wage is minimized, net economic
benefits are less than in Case 1, and the deadweight loss is greater than in Case 1.
they pay ($6). Thus, with the minimum wage, consumer surplus falls by an amount
equal to areas C E F. This decline in consumer surplus explains why businesses
often strongly lobby policy makers to keep the minimum wage from being raised.
Also in both cases, employers of the 80 million hours hired at the minimum wage
will pay $6 per hour instead of $5 per hour, thereby incurring an extra cost measured
by areas C E.