Page 441 - Microeconomics, Fourth Edition
P. 441

c10competitive markets applications.qxd  7/15/10  4:58 PM  Page 415


                                                                     10.3 PRODUCTION QUOTAS                     415


                                                   $20
                                                        Consumer surplus
                                                                  Quota   Deadweight loss

                                                  Price (dollars per unit)  $12  A  H  L  K  S
                                                           F


                                                                     B
                                                    $8
                                                    $6
                                                           E         C      G
                                                                     K
                                              Producer
                                                surplus
                                                    $2
                                                        J
                                                                                        D
                                                                   4      6            10
                                                            Quantity (millions of units per year)


                                                               With No Quota    With Quota   Impact of Quota
                               C onsumer surplus              A  + B  + F     F              –A  – B
                                                              ($36 million)   ($16 million)  ( –$20 million)

                               Producer surplus               C  + E          A  + E         A  – C
                                                              ($18 million)   ($32 million)  ($14 million)

                               Net benefits                   A  + B  + C  + E  + F  A  + E  + F   –B  – C
                               (c onsumer surplus + producer surplus)  ($54 million)  ($48 million)  ( –$6 million)
                               Deadweight loss                zero            B  + C ($6 million)   B  + C ($6 million)


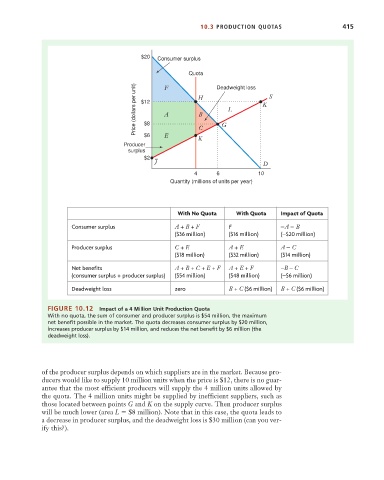
                       FIGURE 10.12    Impact of a 4 Million Unit Production Quota
                       With no quota, the sum of consumer and producer surplus is $54 million, the maximum
                       net benefit possible in the market. The quota decreases consumer surplus by $20 million,
                       increases producer surplus by $14 million, and reduces the net benefit by $6 million (the
                       deadweight loss).


                      of the producer surplus depends on which suppliers are in the market. Because pro-
                      ducers would like to supply 10 million units when the price is $12, there is no guar-
                      antee that the most efficient producers will supply the 4 million units allowed by
                      the quota. The 4 million units might be supplied by inefficient suppliers, such as
                      those located between points G and K on the supply curve. Then producer surplus
                      will be much lower (area L   $8 million). Note that in this case, the quota leads to
                      a decrease in producer surplus, and the deadweight loss is $30 million (can you ver-
                      ify this?).
   436   437   438   439   440   441   442   443   444   445   446