
Page 431 - Microeconomics, Fourth Edition
P. 431
c10competitive markets applications.qxd 7/15/10 4:58 PM Page 405
10.2 PRICE CEILINGS AND FLOORS 405
than $1,000 per month). Consumer surplus is the area below the portion of the
demand curve between points T and X and above the price consumers pay
$1,000) (consumer surplus area H); this is the minimum possible con-
(P R
sumer surplus with rent control. The net economic benefit consumer surplus
producer surplus areas H G. The deadweight loss net economic benefit
with no rent control net economic benefit with rent control (areas A B
C E F G) (areas H G) areas A B C E F H. The
deadweight loss is larger than in Case 1 (by an amount equal to A B C H)
due to the inefficiency in the way in which available housing units are rationed
to consumers.
The two cases just considered define upper and lower limits on the consumer sur-
plus and deadweight loss related to rent controls. The actual consumer surplus and
deadweight loss may be in between the levels in these two polar cases. To find the exact
amounts of consumer surplus and deadweight loss, we would need to know more about
how the available housing is actually allocated. Most textbooks depict the effects of a
price ceiling with a graph like the one in Case 1 of Figure 10.7, assuming that the good
ends up in the hands of consumers with the highest willingness to pay. This assump-
tion is reasonable when consumers can easily resell the good to other consumers with
a higher willingness to pay, but as Application 10.2 suggests, it may not hold in prac-
tice, even though they might not be able to obtain the good when it is initially sold.
APPLICA TION 10.4
Ceilings and Shortages: Food
in Venezuela
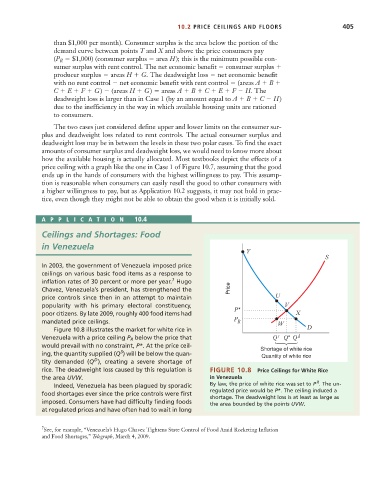
Y
S
In 2003, the government of Venezuela imposed price
ceilings on various basic food items as a response to
7
inflation rates of 30 percent or more per year. Hugo
Chavez, Venezuela’s president, has strengthened the Price
price controls since then in an attempt to maintain U
popularity with his primary electoral constituency, V
P*
poor citizens. By late 2009, roughly 400 food items had X
mandated price ceilings. P
R
W
Figure 10.8 illustrates the market for white rice in D
Venezuela with a price ceiling P R below the price that Q s Q* Q d
would prevail with no constraint, P*. At the price ceil- Shortage of white rice
S
ing, the quantity supplied (Q ) will be below the quan- Quantity of white rice
D
tity demanded (Q ), creating a severe shortage of
rice. The deadweight loss caused by this regulation is FIGURE 10.8 Price Ceilings for White Rice
the area UVW. in Venezuela R
Indeed, Venezuela has been plagued by sporadic By law, the price of white rice was set to P . The un-
regulated price would be P*. The ceiling induced a
food shortages ever since the price controls were first
shortage. The deadweight loss is at least as large as
imposed. Consumers have had difficulty finding foods the area bounded by the points UVW.
at regulated prices and have often had to wait in long
7 See, for example, “Venezuela’s Hugo Chavez Tightens State Control of Food Amid Rocketing Inflation
and Food Shortages,” Telegraph, March 4, 2009.