Page 428 - Microeconomics, Fourth Edition
P. 428

c10competitive markets applications.qxd  7/15/10  4:58 PM  Page 402


                  402                   CHAPTER 10   COMPETITIVE MARKETS: APPLICATIONS


                                          Y                               Y
                              Rental price (dollars per month)  P  = $1,600  A  U  V  S  X  A  U  V  T S  X


                                          B
                                                                          B
                                                                                E
                                                E
                                 *
                                                                                F
                                          C
                                                                          C
                                                F
                                P  = $1,000
                                 R
                                       Z  G     W                  D   Z  G     W       H           D
                                            Q  = 50 Q* = 80  Q  = 140        Q  = 50  80  90  Q  = 140
                                                                              s
                                                                                             d
                                                             d
                                              s
                                                Housing shortage                 Housing shortage
                                          Quantity (thousands of housing units)  Quantity (thousands of housing units)
                                          Case 1: Maximum consumer surplus  Case 2: Minimum consumer surplus
                                                                 With Rent Control     Impact of Rent Control
                                                              Case 1      Case 2    Case 1       Case 2
                                              Free Market    (maximum   (minimum   (maximum    (minimum
                                               ( with no     consumer   consumer   consumer    consumer
                                             r ent control)   surplus)   surplus)   surplus)    surplus)
                        C onsumer surplus   A + B + E        A  + B + C  H          C  – E    –A – B  – E + H
                        Producer surplus   C + F + G         G         G            –C – F    –C – F
                        Net benefits     A + B + C + E + F + G  A  + B +  H + G     –E – F    –A – B – C  –
                        (c onsumer surplus  +                C + G                            E  – F + H
                        producer surplus)
                        Deadweight loss  zero                E + F     A  + B + C  +  E + F   A  + B + C  + E  +

                                                                       E + F – H              F  – H

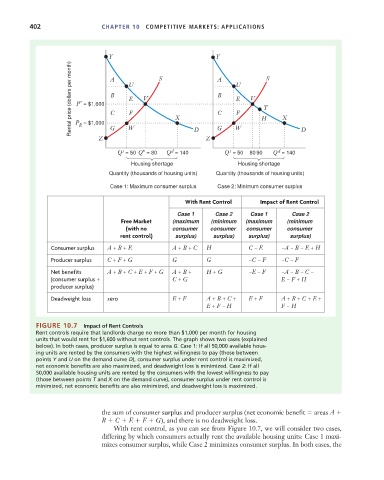
                    FIGURE 10.7   Impact of Rent Controls
                    Rent controls require that landlords charge no more than $1,000 per month for housing
                    units that would rent for $1,600 without rent controls. The graph shows two cases (explained
                    below). In both cases, producer surplus is equal to area G. Case 1: If all 50,000 available hous-
                    ing units are rented by the consumers with the highest willingness to pay (those between
                    points Y and U on the demand curve D), consumer surplus under rent control is maximized,
                    net economic benefits are also maximized, and deadweight loss is minimized. Case 2: If all
                    50,000 available housing units are rented by the consumers with the lowest willingness to pay
                    (those between points T and X on the demand curve), consumer surplus under rent control is
                    minimized, net economic benefits are also minimized, and deadweight loss is maximized.


                                        the sum of consumer surplus and producer surplus (net economic benefit   areas A
                                        B   C   E   F   G), and there is no deadweight loss.
                                           With rent control, as you can see from Figure 10.7, we will consider two cases,
                                        differing by which consumers actually rent the available housing units: Case 1 maxi-
                                        mizes consumer surplus, while Case 2 minimizes consumer surplus. In both cases, the
   423   424   425   426   427   428   429   430   431   432   433