
Page 424 - Microeconomics, Fourth Edition
P. 424
c10competitive markets applications.qxd 7/15/10 4:58 PM Page 398
398 CHAPTER 10 COMPETITIVE MARKETS: APPLICATIONS
• The impact on the government budget will be negative. Government expenditures
on the subsidy constitute a negative net economic benefit since the money to pay
for the subsidy must be collected elsewhere in the economy.
• Government expenditures on the subsidy will be larger than the increase in
consumer and producer surplus. Thus, there will be a deadweight loss from
overproduction.
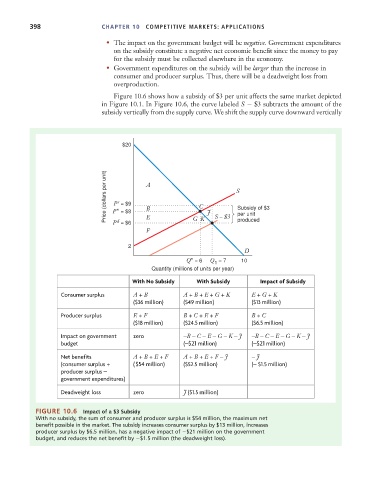
Figure 10.6 shows how a subsidy of $3 per unit affects the same market depicted
in Figure 10.1. In Figure 10.6, the curve labeled S $3 subtracts the amount of the
subsidy vertically from the supply curve. We shift the supply curve downward vertically
$20
Price (dollars per unit) P* = $8 A C J S S S Subsidy of $3
P = $9
s
B
per unit
E
P = $6
d
F G K S – $3 produced
2
D
Q* = 6 Q = 7 10
1
Quantity (millions of units per year)
With No Subsidy With Subsidy Impact of Subsidy
C onsumer surplus A + B A + B + E + G + K E + G + K
($36 million) ($49 million) ($13 million)
Producer surplus E + F B + C + E + F B + C
($18 million) ($24.5 million) ($6.5 million)
Impact on government zero –B – C – E – G – K – J –B – C – E – G – K – J
budget ( –$21 million) ( –$21 million)
Net benefits A + B + E + F A + B + E + F – J – J
(c onsumer surplus + ( $54 million) ($52.5 million) ( – $1.5 million)
producer surplus –
g ov ernment expenditures)
Deadweight loss zero J ($1.5 million)
FIGURE 10.6 Impact of a $3 Subsidy
With no subsidy, the sum of consumer and producer surplus is $54 million, the maximum net
benefit possible in the market. The subsidy increases consumer surplus by $13 million, increases
producer surplus by $6.5 million, has a negative impact of $21 million on the government
budget, and reduces the net benefit by $1.5 million (the deadweight loss).