
Page 433 - Microeconomics, Fourth Edition
P. 433
c10competitive markets applications.qxd 7/15/10 4:58 PM Page 407
10.2 PRICE CEILINGS AND FLOORS 407
supply. As time passed, the shortage grew substantially. By 1973, imports made up
nearly 33 percent of the total oil consumed in the United States. OPEC countries
recognized the growing dependence on imports in the United States, and they re-
sponded by quadrupling the price of imported oil. In the end the domestic price con-
trols contributed to still higher inflation in the United States, working against their
original intent. 9
LEARNING-BY-DOING EXERCISE 10.3
S
D
E
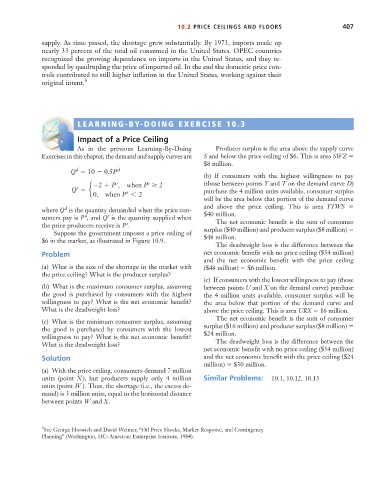
Impact of a Price Ceiling
As in the previous Learning-By-Doing Producer surplus is the area above the supply curve
Exercises in this chapter, the demand and supply curves are S and below the price ceiling of $6. This is area SWZ
$8 million.
d
Q 10 0.5P d
(b) If consumers with the highest willingness to pay
s
s
2 P , when P 2 (those between points Y and T on the demand curve D)
s
Q e s purchase the 4 million units available, consumer surplus
0, when P 6 2
will be the area below that portion of the demand curve
and above the price ceiling. This is area YTWS
d
where Q is the quantity demanded when the price con- $40 million.
d
s
sumers pay is P , and Q is the quantity supplied when The net economic benefit is the sum of consumer
the price producers receive is P . s surplus ($40 million) and producer surplus ($8 million)
Suppose the government imposes a price ceiling of
$6 in the market, as illustrated in Figure 10.9. $48 million.
The deadweight loss is the difference between the
Problem net economic benefit with no price ceiling ($54 million)
and the net economic benefit with the price ceiling
(a) What is the size of the shortage in the market with ($48 million) $6 million.
the price ceiling? What is the producer surplus?
(c) If consumers with the lowest willingness to pay (those
(b) What is the maximum consumer surplus, assuming between points U and X on the demand curve) purchase
the good is purchased by consumers with the highest the 4 million units available, consumer surplus will be
willingness to pay? What is the net economic benefit? the area below that portion of the demand curve and
What is the deadweight loss? above the price ceiling. This is area URX 16 million.
The net economic benefit is the sum of consumer
(c) What is the minimum consumer surplus, assuming
the good is purchased by consumers with the lowest surplus ($16 million) and producer surplus ($8 million)
willingness to pay? What is the net economic benefit? $24 million.
What is the deadweight loss? The deadweight loss is the difference between the
net economic benefit with no price ceiling ($54 million)
Solution and the net economic benefit with the price ceiling ($24
million) $30 million.
(a) With the price ceiling, consumers demand 7 million
units (point X ), but producers supply only 4 million Similar Problems: 10.1, 10.12, 10.13
units (point W ). Thus, the shortage (i.e., the excess de-
mand) is 3 million units, equal to the horizontal distance
between points W and X.
9 See George Horwich and David Weimer, “Oil Price Shocks, Market Response, and Contingency
Planning” (Washington, DC: American Enterprise Institute, 1984).