
Page 729 - Microeconomics, Fourth Edition
P. 729
c17ExternalitiesandPublicGoods.qxd 8/22/10 4:56 AM Page 703
17.2 EXTERNALITIES 703
A MSC
Price MPC = Market supply
P*
M
B
G K
1
P
MPC at Q* E H N
F R
D
MEC
Z V
Q* Q 1
Tons of the chemical per week
= units of pollutant per week
Difference
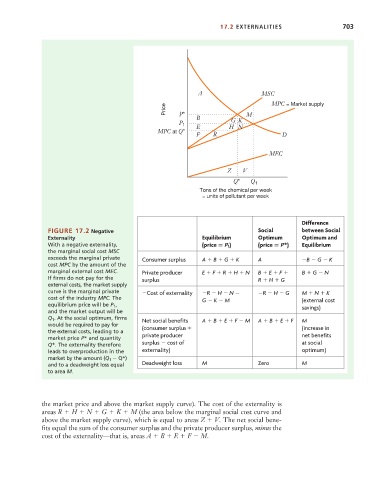
FIGURE 17.2 Negative Social between Social
Externality Equilibrium Optimum Optimum and
With a negative externality, (price P 1) (price P*) Equilibrium
the marginal social cost MSC
exceeds the marginal private Consumer surplus A B G K A B G K
cost MPC by the amount of the
marginal external cost MEC. Private producer E F R H N B E F B G N
If firms do not pay for the surplus R H G
external costs, the market supply
curve is the marginal private Cost of externality R H N R H G M N K
cost of the industry MPC. The G K M (external cost
equilibrium price will be P 1 , savings)
and the market output will be
Q 1 . At the social optimum, firms Net social benefits A B E F M A B E F M
would be required to pay for (consumer surplus (increase in
the external costs, leading to a private producer net benefits
market price P* and quantity
Q*. The externality therefore surplus cost of at social
leads to overproduction in the externality) optimum)
market by the amount (Q 1 Q*)
and to a deadweight loss equal Deadweight loss M Zero M
to area M.
the market price and above the market supply curve). The cost of the externality is
areas R H N G K M (the area below the marginal social cost curve and
above the market supply curve), which is equal to areas Z V. The net social bene-
fits equal the sum of the consumer surplus and the private producer surplus, minus the
cost of the externality—that is, areas A B E F M.