
Page 441 - Economics
P. 441
CONFIRMING PAGES
CHAPTER NINETEEN APPENDIX 373
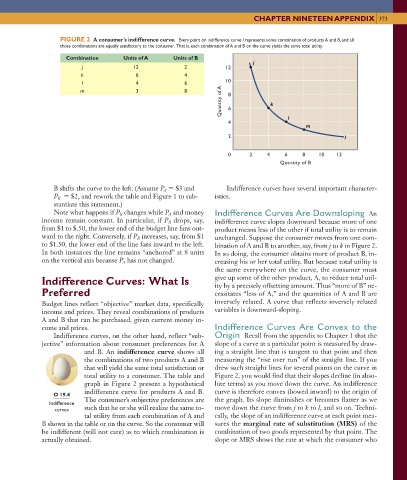
FIGURE 2 A consumer’s indifference curve. Every point on indifference curve I represents some combination of products A and B, and all
those combinations are equally satisfactory to the consumer. That is, each combination of A and B on the curve yields the same total utility.
Combination Units of A Units of B
j
j 12 2 12
k 6 4
l 4 6 10
Quantity of A 6 k
m 3 8 8
l
4
m
2 I
0 2 4 6 8 10 12
Quantity of B
B shifts the curve to the left. (Assume P $3 and Indifference curves have several important character-
A
P $2, and rework the table and Figure 1 to sub- istics.
B
stantiate this statement.)
Note what happens if P changes while P and money Indifference Curves Are Downsloping An
B
A
income remain constant. In particular, if P drops, say, indifference curve slopes downward because more of one
B
from $1 to $.50, the lower end of the budget line fans out- product means less of the other if total utility is to remain
ward to the right. Conversely, if P increases, say, from $1 unchanged. Suppose the consumer moves from one com-
B
to $1.50, the lower end of the line fans inward to the left. bination of A and B to another, say, from j to k in Figure 2 .
In both instances the line remains “anchored” at 8 units In so doing, the consumer obtains more of product B, in-
on the vertical axis because P has not changed. creasing his or her total utility. But because total utility is
A
the same everywhere on the curve, the consumer must
Indifference Curves: What Is give up some of the other product, A, to reduce total util-
ity by a precisely offsetting amount. Thus “more of B” ne-
Preferred cessitates “less of A,” and the quantities of A and B are
Budget lines reflect “objective” market data, specifically inversely related. A curve that reflects inversely related
income and prices. They reveal combinations of products variables is downward-sloping.
A and B that can be purchased, given current money in-
come and prices. Indifference Curves Are Convex to the
Indifference curves, on the other hand, reflect “sub- Origin Recall from the appendix to Chapter 1 that the
jective” information about consumer preferences for A slope of a curve at a particular point is measured by draw-
and B. An indifference curve shows all ing a straight line that is tangent to that point and then
the combinations of two products A and B measuring the “rise over run” of the straight line. If you
that will yield the same total satisfaction or drew such straight lines for several points on the curve in
total utility to a consumer. The table and Figure 2 , you would find that their slopes decline (in abso-
graph in Figure 2 present a hypothetical lute terms) as you move down the curve. An indifference
indifference curve for products A and B. curve is therefore convex (bowed inward) to the origin of
O 19.4
The consumer’s subjective preferences are the graph. Its slope diminishes or becomes flatter as we
Indifference
curves such that he or she will realize the same to- move down the curve from j to k to l , and so on. Techni-
tal utility from each combination of A and cally, the slope of an indifference curve at each point mea-
B shown in the table or on the curve. So the consumer will sures the marginal rate of substitution (MRS) of the
be indifferent (will not care) as to which combination is combination of two goods represented by that point. The
actually obtained. slope or MRS shows the rate at which the consumer who
6/3/06 12:53:25 PM
mcc26632_ch19_359-377.indd 373
mcc26632_ch19_359-377.indd 373 6/3/06 12:53:25 PM