
Page 774 - Economics
P. 774
CONFIRMING PAGES
CHAPTER 35
683
International Trade
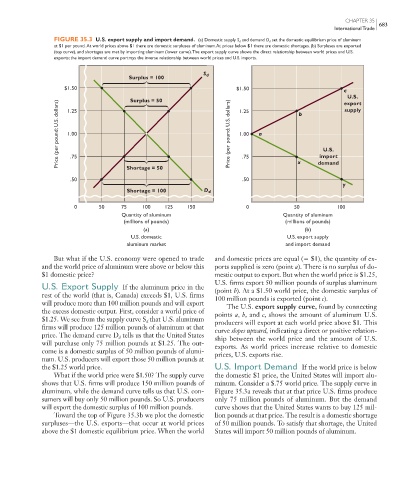
FIGURE 35.3 U.S. export supply and import demand. (a) Domestic supply S d and demand D d set the domestic equilibrium price of aluminum
at $1 per pound. At world prices above $1 there are domestic surpluses of aluminum. At prices below $1 there are domestic shortages. (b) Surpluses are exported
(top curve), and shortages are met by importing aluminum (lower curve). The export supply curve shows the direct relationship between world prices and U.S.
exports; the import demand curve portrays the inverse relationship between world prices and U.S. imports.
S d
Surplus = 100
$1.50 $1.50
c
U.S.
Surplus = 50
Price (per pound; U.S. dollars) 1.00 Price (per pound; U.S. dollars) 1.00 a import
export
supply
1.25
1.25
b
U.S.
.75
.75
.50 Shortage = 50 .50 x demand
y
Shortage = 100 D d
0 50 75 100 125 150 0 50 100
Quantity of aluminum Quantity of aluminum
(millions of pounds) (millions of pounds)
(a) (b)
U.S. domestic U.S. export supply
aluminum market and import demand
But what if the U.S. economy were opened to trade and domestic prices are equal ( $1), the quantity of ex-
and the world price of aluminum were above or below this ports supplied is zero (point a ). There is no surplus of do-
$1 domestic price? mestic output to export. But when the world price is $1.25,
U.S. firms export 50 million pounds of surplus aluminum
U.S. Export Supply If the aluminum price in the (point b ). At a $1.50 world price, the domestic surplus of
rest of the world (that is, Canada) exceeds $1, U.S. firms 100 million pounds is exported (point c ).
will produce more than 100 million pounds and will export The U.S. export supply curve, found by connecting
the excess domestic output. First, consider a world price of points a , b , and c , shows the amount of aluminum U.S.
$1.25. We see from the supply curve S that U.S. aluminum producers will export at each world price above $1. This
d
firms will produce 125 million pounds of aluminum at that curve slopes upward, indicating a direct or positive relation-
price. The demand curve D tells us that the United States ship between the world price and the amount of U.S.
d
will purchase only 75 million pounds at $1.25. The out- exports. As world prices increase relative to domestic
come is a domestic surplus of 50 million pounds of alumi- prices, U.S. exports rise.
num. U.S. producers will export those 50 million pounds at
the $1.25 world price. U.S. Import Demand If the world price is below
What if the world price were $1.50? The supply curve the domestic $1 price, the United States will import alu-
shows that U.S. firms will produce 150 million pounds of minum. Consider a $.75 world price. The supply curve in
aluminum, while the demand curve tells us that U.S. con- Figure 35.3a reveals that at that price U.S. firms produce
sumers will buy only 50 million pounds. So U.S. producers only 75 million pounds of aluminum. But the demand
will export the domestic surplus of 100 million pounds. curve shows that the United States wants to buy 125 mil-
Toward the top of Figure 35.3b we plot the domestic lion pounds at that price. The result is a domestic shortage
surpluses—the U.S. exports—that occur at world prices of 50 million pounds. To satisfy that shortage, the United
above the $1 domestic equilibrium price. When the world States will import 50 million pounds of aluminum.
mcc26632_ch35_674-695.indd 683 9/14/06 4:32:08 PM
9/14/06 4:32:08 PM
mcc26632_ch35_674-695.indd 683