
Page 775 - Economics
P. 775
CONFIRMING PAGES
PART TEN
684
International Economics
At an even lower world price, $.50, U.S. producers prices to U.S. dollar prices via the exchange rate.) Note that
will supply only 50 million pounds. Because U.S. consum- the domestic supply curve S and the domestic demand
d
ers want to buy 150 million pounds at that price, there is a curve D for aluminum in Canada yield a domestic price of
d
domestic shortage of 100 million pounds. Imports will $.75, which is $.25 lower than the $1 U.S. domestic price.
flow to the United States to make up the difference. That The analysis proceeds exactly as above except that the
is, at a $.50 world price U.S. firms will supply 50 million domestic price is now the Canadian price. If the world price
pounds and 100 million pounds will be imported. is $.75, Canadians will neither export nor import aluminum
In Figure 35.3b we plot the U.S. import demand curve (giving us point q in Figure 35.4b ). At world prices above
from these data. This downsloping curve shows the amounts $.75, Canadian firms will produce more aluminum than
of aluminum that will be imported at world prices below the Canadian consumers will buy. Canadian firms will export
$1 U.S. domestic price. The relationship between world the surplus. At a $1 world price, Figure 35.4b tells us that
prices and imported amounts is inverse or negative. At a Canada will have and export a domestic surplus of 50 million
world price of $1, domestic output will satisfy U.S. demand; pounds (yielding point r ). At $1.25, it will have and will
imports will be zero (point a ). But at $.75 the United States export a domestic surplus of 100 million pounds (point s ).
will import 50 million pounds of aluminum (point x ); at Connecting these points yields the upsloping Canadian ex-
$.50, the United States will import 100 million pounds port supply curve, which reflects the domestic surpluses
(point y ). Connecting points a, x, and y yields the downsloping (and hence the exports) that occur when the world price
U.S. import demand curve. It reveals that as world prices fall exceeds the $.75 Canadian domestic price.
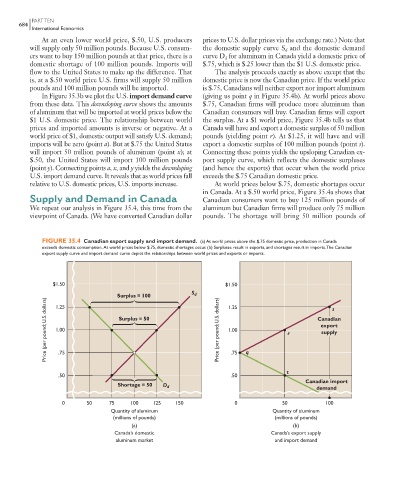
relative to U.S. domestic prices, U.S. imports increase. At world prices below $.75, domestic shortages occur
in Canada. At a $.50 world price, Figure 35.4a shows that
Supply and Demand in Canada Canadian consumers want to buy 125 million pounds of
We repeat our analysis in Figure 35.4 , this time from the aluminum but Canadian firms will produce only 75 million
viewpoint of Canada. (We have converted Canadian dollar pounds. The shortage will bring 50 million pounds of
FIGURE 35.4 Canadian export supply and import demand. (a) At world prices above the $.75 domestic price, production in Canada
exceeds domestic consumption. At world prices below $.75, domestic shortages occur. (b) Surpluses result in exports, and shortages result in imports. The Canadian
export supply curve and import demand curve depict the relationships between world prices and exports or imports.
$1.50 $1.50
Surplus = 100 S d 1.25 s
Price (per pound; U.S. dollars) 1.00 Surplus = 50 Price (per pound; U.S. dollars) 1.00 r Canadian
1.25
export
supply
q
.75
.75
t
.50 .50
Canadian import
Shortage = 50 D d
demand
0 50 75 100 125 150 0 50 100
Quantity of aluminum Quantity of aluminum
(millions of pounds) (millions of pounds)
(a) (b)
Canada’s domestic Canada’s export supply
aluminum market and import demand
9/18/06 5:45:57 PM
mcc26632_ch35_674-695.indd 684 9/18/06 5:45:57 PM
mcc26632_ch35_674-695.indd 684