
Page 89 - ISCI’2017
P. 89
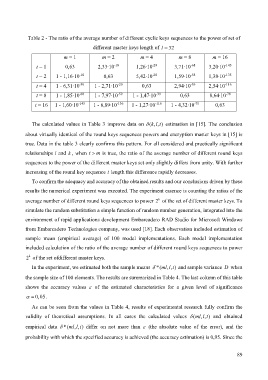
Table 2 - The ratio of the average number of different cyclic keys sequences to the power of set of
                                          different master keys length of  l =  32

                             m = 1            m = 2            m = 4            m = 8          m = 16
                                                                     -29
                                                                                      -68
                 t = 1        0,63          2,33∙10          1,26∙10          3,71∙10         3,20∙10 -145
                                                    -10
                                                                     -20
                                    -10
                 t = 2    1 - 1,16∙10          0,63          5,42∙10          1,59∙10         1,38∙10 -135
                                                                                      -58
                                                                                      -39
                                                     -20
                                    -30
                 t = 4    1 - 6,31∙10      1 - 2,71∙10          0,63          2,94∙10         2,54∙10 -116
                                    -68
                                                                                                     -78
                                                                      -39
                                                     -59
                 t = 8    1 - 1,85∙10      1 - 7,97∙10      1 - 1,47∙10          0,63         8,64∙10
                                                                                       -78
                 t = 16   1 - 1,60∙10 -145    1 - 6,89∙10 -136    1 - 1,27∙10 -116    1 - 4,32∙10    0,63

               The calculated values in Table 3 improve data on  ( ,, )k ltδ   estimation  in [15]. The conclusion
            about virtually identical of the round keys sequences powers and encryption master keys in [15] is
            true. Data in the table 3 clearly confirms this pattern. For all considered and practically significant
            relationships  l and  k , when  t >  m is true, the ratio of the average number of different round keys

            sequences to the power of the different master keys set only slightly differs from unity. With further
            increasing of the round key sequence t length this difference rapidly decreases.

               To confirm the adequacy and accuracy of the obtained results and our conclusions driven by these

            results the numerical experiment was executed. The experiment essence is counting the ratios of the
            average number of different round keys sequences to power 2  of the set of different master keys. To
                                                                       k
            simulate the random substitution a simple function of random number generation, integrated into the

            environment of rapid applications development Embarcadero RAD Studio for Microsoft Windows
            from Embarcadero Technologies company, was used [18]. Each observation included estimation of

            sample  mean (empirical average) of 100 model implementations. Each  model  implementation

            included calculation of the ratio of the average number of different round keys sequences to power
              k
             2  of the set ofdifferent master keys.
               In the experiment, we estimated both the sample means  *(mlltδ  , , ) and sample variance  D  when

            the sample size of 100 elements. The results are summarized in Table 4. The last column of this table
            shows the accuracy  values  ε  of the estimated characteristics  for a given  level of significance

             α = 0,05 .

               As can be seen  from the values in Table 4, results of experimental research  fully confirm the

            validity of theoretical assumptions. In all  cases the calculated values  (mlltδ  ,, )  and obtained

            empirical data  *(mlltδ  , , )  differ on not more  than  ε  (the absolute value of the error), and  the
            probability with which the specified accuracy is achieved (the accuracy estimation) is 0,95. Since the


                                                                                                          89