Page 493 - Foundations of Marketing
P. 493

460       Part 6  | Promotion Decisions


                   advertising appropriation      if the advertisements communicate information that consumers do not deem important when
                The advertising budget for a   selecting and using the product.
                specific time period

                   objective-and-task               Determining the Advertising Appropriation
                approach    Budgeting for an
                advertising campaign by first      The   advertising appropriation      is the total amount of money a marketer allocates for advertis-
                determining its objectives and   ing for a specific time period. For instance, Panera Bread Co. spends approximately     1.5     percent
                                                                     9
                then calculating the cost of all   of its annual sales on advertising.                                            Many factors affect a firm’s decision about how much to
                the tasks needed to attain them    appropriate for advertising. Geographic size of the market and the distribution of buyers within
                                                                                  the market have a great bearing on this deci-
                                                                                  sion. Both the type of product advertised
                                                                                  and the firm’s sales volume relative to com-
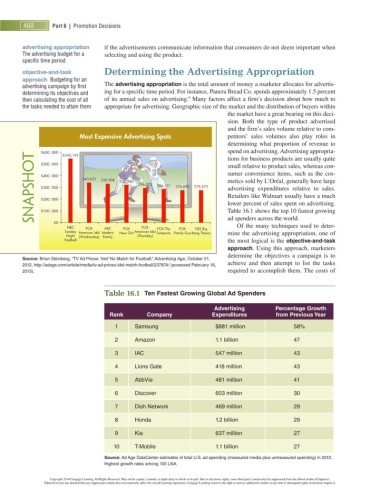
                                  Most Expensive Advertising Spots                petitors’ sales volumes also play roles in
                                                                                  determining what proportion of revenue to
                                                                                  spend on advertising. Advertising appropria-
                      $600. 000
                    Snapshot  $400. 000  340,825  330,908  320,940  296,002  286,131  276,690  275,573  small relative to product sales, whereas con-
                             $545,142
                                                                                  tions for business products are usually quite
                      $500. 000
                                                                                  sumer convenience items, such as the cos-
                                                                                  metics sold by L’Oréal, generally have large
                                                                                  advertising expenditures relative to sales.
                      $300. 000
                                                                                  Retailers like Walmart usually have a much
                      $200. 000
                                                                                  lower percent of sales spent on advertising.
                      $100. 000
                                                                                  ad spenders across the world.


                          $0
                                                                                         Of the many techniques used to deter-
                              NBC   FOX   ABC   FOX   FOX  FOX The  FOX  CBS Big    Table 16.1    shows the top     10     fastest growing
                              Sunday American Idol Modern  New Girl  American Idol  Simpsons Family Guy Bang Theory  mine the advertising appropriation, one of
                              Night  (Wednesday)  Family  (Thursday)
                              Football                                            the most logical is the   objective-and-task
                                                                                  approach     . Using this approach, marketers
                                                                                  determine the objectives a campaign is to
                                                                                                                                          Source: Brian Steinberg, “TV Ad Prices: ‘Idol’ No Match for Football,”  Advertising Age , October 21,
                                                                                  achieve and then attempt to list the tasks
                2012,  http://adage.com/article/media/tv-ad-prices-idol-match-football/237874/  (accessed February 16,
                2013).                                                            required to accomplish them. The costs of
                                              Table  16.1    Ten Fastest Growing Global Ad Spenders
                                                                                Advertising         Percentage Growth
                                                Rank    Company              Expenditures         from Previous Year
                                                          1       Samsung     $    881     million               58  %

                                                          2       Amazon              1.1     billion             47
                                                          3       IAC                 547     million             43

                                                          4       Lions Gate             418     million             43

                                                          5       AbbVie              481     million             41
                                                          6       Discover            603     million             30

                                                          7       Dish Network             469     million             29

                                                          8       Honda               1.2     billion             29

                                                          9       Kia                 637     million             27
                                                         10       T-Mobile            1.1     billion             27
                                          Source: Ad Age DataCenter estimates of total U.S. ad spending (measured media plus unmeasured spending) in 2012.
                                          Highest growth rates among 100 LNA.

                         Copyright 2014 Cengage Learning. All Rights Reserved. May not be copied, scanned, or duplicated, in whole or in part. Due to electronic rights, some third party content may be suppressed from the eBook and/or eChapter(s).
                       Editorial review has deemed that any suppressed content does not materially affect the overall learning experience. Cengage Learning reserves the right to remove additional content at any time if subsequent rights restrictions require it.
   488   489   490   491   492   493   494   495   496   497   498