
Page 291 - Project+
P. 291
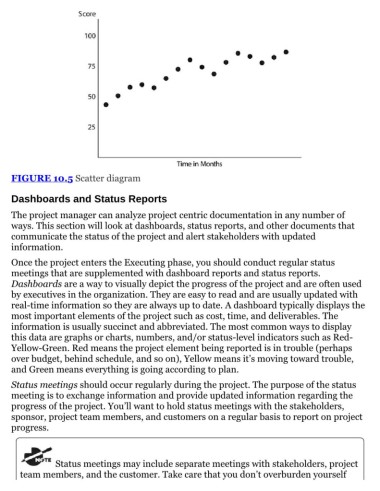
FIGURE 10.5 Scatter diagram


     Dashboards and Status Reports

     The project manager can analyze project centric documentation in any number of

     ways. This section will look at dashboards, status reports, and other documents that
     communicate the status of the project and alert stakeholders with updated
     information.

     Once the project enters the Executing phase, you should conduct regular status
     meetings that are supplemented with dashboard reports and status reports.
     Dashboards are a way to visually depict the progress of the project and are often used

     by executives in the organization. They are easy to read and are usually updated with
     real-time information so they are always up to date. A dashboard typically displays the
     most important elements of the project such as cost, time, and deliverables. The
     information is usually succinct and abbreviated. The most common ways to display
     this data are graphs or charts, numbers, and/or status-level indicators such as Red-
     Yellow-Green. Red means the project element being reported is in trouble (perhaps

     over budget, behind schedule, and so on), Yellow means it’s moving toward trouble,
     and Green means everything is going according to plan.

     Status meetings should occur regularly during the project. The purpose of the status
     meeting is to exchange information and provide updated information regarding the
     progress of the project. You’ll want to hold status meetings with the stakeholders,
     sponsor, project team members, and customers on a regular basis to report on project
     progress.


                   Status meetings may include separate meetings with stakeholders, project
       team members, and the customer. Take care that you don’t overburden yourself


                                                            291