
Page 127 - Environment: The Science Behind the Stories
P. 127
of circuits and parts that interact and exchange energy and The dead zones in the Chesapeake Bay are due to the
information—but where are its boundaries? Is the system extremely high levels of nitrogen and phosphorus delivered
merely the phone itself, or does it include the other phones to its waters from the 6 states in its watershed and the 15
you call, the websites you access on it, and the cellular and states in its airshed—the geographic area that produces air
Wi-Fi networks that keep it connected? What about the energy pollutants that are likely to end up in a waterway. In 2007, the
grid that recharges the phone’s battery, with its transmission bay received an estimated 127 million kg (281 million lb) of
lines and distant power plants? nitrogen and 8.3 million kg (18.2 million lb) of phosphorus,
No matter how we attempt to isolate or define a system, with roughly one-third of nitrogen inputs from atmospheric
we soon see that it has connections to systems larger and sources. Agriculture was a major source of these nutrients,
smaller than itself. Systems may exchange energy, matter, and contributing 40% of the nitrogen (Figure 5.4a) and 45% of the
information with other systems, and they may contain or be phosphorus (Figure 5.4b) entering the bay.
contained within other systems. Thus, where we draw bound- Elevated nitrogen and phosphorus inputs cause phyto-
aries may depend on the spatial (space) or temporal (time) plankton in the bay’s waters to flourish. High densities lead
scale at which we choose to focus. to elevated mortality in phytoplankton populations, and dead
phytoplankton settle to the bottom of the bay. The remains
Environmental systems interact of dead phytoplankton are joined on the bottom by the waste
products of zooplankton, tiny creatures that feed on phyto-
The Chesapeake Bay and the rivers that empty into it are an plankton. The abundance of organic material causes an explo-
example of interacting systems. On a map, these rivers are a sion in populations of bacterial decomposers, which deplete
branched and braided network of water channels surrounded the oxygen in bottom waters while consuming this material.
by farms, cities, and forests (Figure 5.3). But where are the Deprived of oxygen, organisms will flee if they can or will
boundaries of this system? For a scientist interested in runoff suffocate if they cannot. Oxygen replenishes slowly at the bot-
(precipitation that flows over land and enters waterways) and tom because fresh water entering the bay from rivers remains
the flow of water, sediment, or pollutants, it may make the naturally stratified in a layer at the surface and is slow to mix
most sense to view the bay’s watershed as a system. However, with the denser, saltier bay water. This limits the amount of
for a scientist interested in the bay’s dead zones, it may be best oxygenated surface water that reaches the bottom-dwelling
to view the watershed together with the bay as the system of life that needs it. The process of nutrient overenrichment,
interest, because their interaction is central to the problem. In blooms of algae, increased production of organic matter, and
environmental science, identifying the boundaries of systems subsequent ecosystem degradation is known as eutrophication
depends on the questions being addressed. (Figure 5.5).
Dissolved oxygen
Boundaries of watershed –1
10.0 mg l
Lake Erie Baltimore
Forests Chesapeake Bay Binghamton
watershed Washington, D.C.
0.0 mg l –1
S u s q u e h a n n a R i v e r New York City
Pittsburgh
Industry Harrisburg
Philadelphia
P o t o m a c R i v e r
Baltimore
Washington, D.C.
Richmond
Cities
J a m e s R i v e r
Richmond
Norfolk
Norfork
Farms
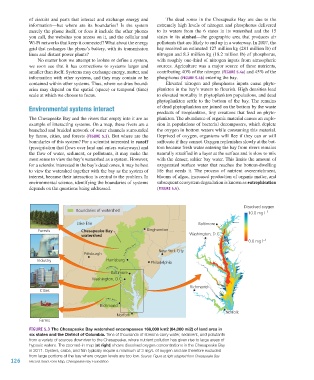
Figure 5.3 The Chesapeake Bay watershed encompasses 168,000 km2 (64,000 mi2) of land area in
six states and the District of Columbia. Tens of thousands of streams carry water, sediment, and pollutants
from a variety of sources downriver to the Chesapeake, where nutrient pollution has given rise to large areas of
hypoxic waters. The zoomed-in map (at right) shows dissolved oxygen concentrations in the Chesapeake Bay
in 2011. Oysters, crabs, and fish typically require a minimum of 3 mg/L of oxygen and are therefore excluded
from large portions of the bay where oxygen levels are too low. Source: Figure at right adapted from Chesapeake Bay
126 Record Dead Zone Map, Chesapeake Bay Foundation.
M05_WITH7428_05_SE_C05.indd 126 12/12/14 2:56 PM