
Page 130 - Environment: The Science Behind the Stories
P. 130
through food-web relationships (pp. 100–101). Matter is recy- results in geographic patterns across the globe (Figure 5.8).
cled because when organisms die and decay, their nutrients In terrestrial ecosystems, net primary productivity tends to
remain in the system. In contrast, most energy that organisms increase with temperature and precipitation. In aquatic eco-
take in drives cellular respiration and is released as heat. systems, net primary productivity tends to rise with light and
the availability of nutrients.
Energy is converted to biomass
As autotrophs, such as green plants and phytoplankton, con- Nutrients influence productivity
vert solar energy to the energy of chemical bonds in sug-
ars through photosynthesis (p. 50), they perform primary Nutrients are elements and compounds (pp. 41–44) that organ-
production. Specifically, the total amount of chemical energy isms consume and require for survival. Organisms need sev-
produced by autotrophs is termed gross primary production. eral dozen naturally occurring nutrients to survive. Elements
Autotrophs use most of this production to power their own and compounds required in relatively large amounts (such as
metabolism by cellular respiration (p. 50). The energy that nitrogen, carbon, and phosphorus) are called macronutrients.
remains after respiration and that is used to generate bio- Nutrients needed in small amounts are called micronutrients
mass (such as leaves, stems, and roots; p. 100) ecologists (examples include zinc, copper, and iron).
call net primary production. Thus, net primary production Nutrients stimulate production by plants, and lack of
equals gross primary production minus the energy used in nutrients can limit production. As mentioned earlier, the avail-
respiration. ability of nitrogen or phosphorus frequently is a limiting fac-
Another way to think of net primary production is that it tor (p. 85) for plant or algal growth. When these nutrients are
represents the energy or biomass available for consumption added to a system, producers show the greatest response to
by heterotrophs. Some of this plant biomass is eaten by her- whichever nutrient has been in shortest supply. Nitrogen tends
bivores. Plant matter not eaten by herbivores becomes fodder to be limiting in marine systems, and phosphorus in fresh-
for detritivores and decomposers once the plant dies or drops water systems, though both contribute to eutrophication in all
its leaves. Heterotrophs use the energy they gain from plant waters. Thus eutrophication in the Chesapeake Bay is driven
biomass for their own metabolism, growth, and reproduction. by excess nitrogen, whereas eutrophication in the freshwa-
Some of this energy is used by heterotrophs to generate bio- ter ponds and lakes in the bay’s watershed are spurred by
mass in their bodies (such as skin, muscle, or bone), which is increases in phosphorus.
termed secondary production. Canadian ecologist David Schindler and others demon-
Ecosystems vary in the rate at which autotrophs convert strated the effects of phosphorus on freshwater systems in
energy to biomass. The rate at which this conversion occurs the 1970s by experimentally manipulating entire lakes. In
is termed productivity, and ecosystems whose plants convert one experiment, his team bisected a 16-ha (40-acre) lake in
solar energy to biomass rapidly are said to have high net Ontario with a plastic barrier. To one half the researchers
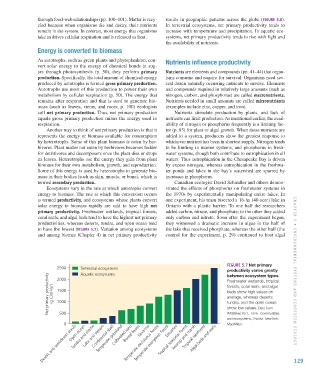
primary productivity. Freshwater wetlands, tropical forests, added carbon, nitrate, and phosphate; to the other they added
coral reefs, and algal beds tend to have the highest net primary only carbon and nitrate. Soon after the experiment began,
productivities, whereas deserts, tundra, and open ocean tend they witnessed a dramatic increase in algae in the half of
to have the lowest (Figure 5.7). Variation among ecosystems the lake that received phosphate, whereas the other half (the
and among biomes (Chapter 4) in net primary productivity control for the experiment, p. 29) continued to host algal
Figure 5.7 Net primary
2500 Terrestrial ecosystems productivity varies greatly CHAPTER 5 • Envi R onm E n TA l S y STE m S A nd E C o S y STE m E C ology
Aquatic ecosystems
Net primary productivity (g C/m 2 /yr) 1500 forests, coral reefs, and algal
between ecosystem types.
2000
Freshwater wetlands, tropical
beds show high values on
average, whereas deserts,
1000
tundra, and the open ocean
show low values. Data from
500
Whittaker, R.H., 1975. Communities
and ecosystems, 2nd ed. NewYork:
0 Open ocean Boreal forest Savanna Estuaries MacMillan.
Temperate grassland
Lake and stream
Desert and semidesert shrub Tundra and alpine Continental shelf Cultivated land Temperate evergreen forest Swamp and marsh Algal beds and reefs 129
Temperate deciduous forest
Tropical rainforest
Tropical seasonal forest
M05_WITH7428_05_SE_C05.indd 129 12/12/14 2:56 PM