
Page 134 - Environment: The Science Behind the Stories
P. 134
Satellites orbiting Earth are sending us more and better data
than ever before on how the surface of our planet looks. By
helping us monitor our planet from above, satellite imagery is
making vital contributions to modern environmental science.
A common tool for research in landscape ecology is the Human
geographic information system (GIS). A GIS consists of com- development
puter software that takes multiple types of data (for instance,
on geology, hydrology, topography, vegetation, animal popu-
lations, and human infrastructure) and combines them on a
common set of geographic coordinates. The idea is to create a
complete picture of a landscape and to analyze how elements Fauna and
of the different data sets are arrayed spatially and how they flora
may be correlated.
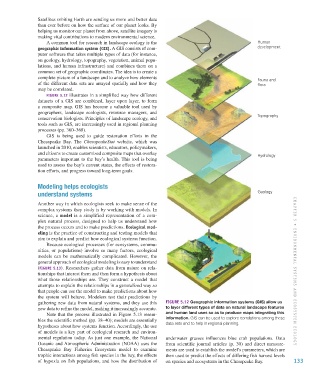
Figure 5.12 illustrates in a simplified way how different
datasets of a GIS are combined, layer upon layer, to form
a composite map. GIS has become a valuable tool used by
geographers, landscape ecologists, resource managers, and
conservation biologists. Principles of landscape ecology, and Topography
tools such as GIS, are increasingly used in regional planning
processes (pp. 360–368).
GIS is being used to guide restoration efforts in the
Chesapeake Bay. The ChesapeakeStat website, which was
launched in 2010, enables scientists, educators, policymakers,
and citizens to create customized composite maps that overlay Hydrology
parameters important to the bay’s health. This tool is being
used to assess the bay’s current status, the effects of restora-
tion efforts, and progress toward long-term goals.
Modeling helps ecologists
understand systems Geology
Another way in which ecologists seek to make sense of the
complex systems they study is by working with models. In
science, a model is a simplified representation of a com-
plex natural process, designed to help us understand how
the process occurs and to make predictions. Ecological mod-
eling is the practice of constructing and testing models that
aim to explain and predict how ecological systems function.
Because ecological processes (for ecosystems, commu-
nities, or populations) involve so many factors, ecological
models can be mathematically complicated. However, the
general approach of ecological modeling is easy to understand
(Figure 5.13). Researchers gather data from nature on rela-
tionships that interest them and then form a hypothesis about CHAPTER 5 • Envi R onm E n TA l S y STE m S A nd E C o S y STE m E C ology
what those relationships are. They construct a model that
attempts to explain the relationships in a generalized way so
that people can use the model to make predictions about how
the system will behave. Modelers test their predictions by
gathering new data from natural systems, and they use this Figure 5.12 Geographic information systems (GIS) allow us
new data to refine the model, making it increasingly accurate. to layer different types of data on natural landscape features
Note that the process illustrated in Figure 5.13 resem- and human land uses so as to produce maps integrating this
bles the scientific method (pp. 38–40); models are essentially information. GIS can be used to explore correlations among these
hypotheses about how systems function. Accordingly, the use data sets and to help in regional planning.
of models is a key part of ecological research and environ-
mental regulation today. As just one example, the National underwater grasses influences blue crab populations. Data
Oceanic and Atmospheric Administration (NOAA) uses the from scientific journal articles (p. 30) and direct measure-
Chesapeake Bay Fisheries Ecosystem model to examine ments are used to establish the model’s parameters, which are
trophic interactions among fish species in the bay, the effects then used to predict the effects of differing fish harvest levels
of hypoxia on fish populations, and how the distribution of on species and ecosystems in the Chesapeake Bay. 133
M05_WITH7428_05_SE_C05.indd 133 12/12/14 2:56 PM