
Page 227 - Environment: The Science Behind the Stories
P. 227
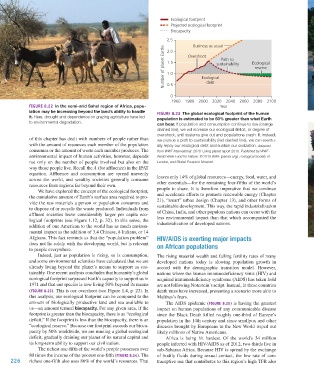
Average per U.S. resident:
                                                                               Ecological footprint                                                                                     • $47,310 annual income
                                                                                                                                                                                                2
                                                                               Projected ecological footprint                                                                           • 30,300 m  of land
                                                                                                                                                                                        • 17.3 metric tons of CO 2
                                                                               Biocapacity
                                                                                                                                                                                        emitted per year
                                                                              2.5        Business as usual
                                                                            Number of planet Earths  1.5  Overshoot  sustainability  Ecological
                                                                              2.0
                                                                                                    Path to
                                                                                                                  reserve
                                                                              1.0
                                                                                            Ecological
                                                                              0.5

                                                                               0              debt
                                                                                1960  1980  2000  2020  2040  2060  2080  2100
                     Figure 8.22  In the semi-arid sahel region of Africa, popu-                    Year
                     lation may be increasing beyond the land’s ability to handle   Figure 8.23  The global ecological footprint of the human
                     it. Here, drought and dependence on grazing agriculture have led   population is estimated to be 50% greater than what Earth         (a) A family living in the United States
                     to environmental degradation.
                                                                          can bear. If population and consumption continue to rise (orange
                                                                          dashed line), we will increase our ecological deficit, or degree of                                         Average per resident of India:
                                                                          overshoot, until systems give out and populations crash. If, instead,                                       • $3400 annual income
                                                                                                                                                                                             2
                     of this chapter has dealt with numbers of people rather than   we pursue a path to sustainability (red dashed line), we can eventu-                              • 2600 m  of land
                     with the amount of resources each member of the population   ally repay our ecological debt and sustain our civilization. Adapted                                • 1.6 metric tons of CO 2
                     consumes or the amount of waste each member produces. The   from WWF International. 2010. Living planet report 2010. Published by WWF-                           emitted per year
                     environmental impact of human activities, however, depends   World Wide Fund for Nature. © 2010 WWF (panda.org), Zoological Society of
                     not only on the number of people involved but also on the   London, and Global Footprint Network.
                     way those people live. Recall the A (for affluence) in the IPAT
                     equation.  Affluence and consumption are spread unevenly
                     across the world, and wealthy societies generally consume   leaves only 14% of global resources—energy, food, water, and
                     resources from regions far beyond their own.         other essentials—for the remaining four-fifths of the world’s
                        We have explored the concept of the ecological footprint,   people to share. It is therefore imperative that we continue
                     the cumulative amount of Earth’s surface area required to pro-  and accelerate efforts to promote renewable energy (Chapter
                     vide the raw materials a person or population consumes and   21), “smart” urban design (Chapter 13), and other forms of
                     to dispose of or recycle the waste produced. Individuals from   sustainable development. This way, the rapid industrialization
                     affluent societies leave considerably larger per capita eco-  of China, India, and other populous nations can occur with far
                     logical footprints (see Figure 1.12, p. 32). In this sense, the   less environmental impact than that which accompanied the
                     addition of one American to the world has as much environ-  industrialization of developed nations.
                     mental impact as the addition of 3.4 Chinese, 8 Indians, or 14
                     Afghans. This fact reminds us that the “population problem”   HIV/AIDS is exerting major impacts
                     does not lie solely with the developing world, but is relevant   on African populations                                              (b) A family living in India
                     to people everywhere.
                        Indeed, just as population is rising, so is consumption,   The rising material wealth and falling fertility rates of many
                     and some environmental scientists have calculated that we are   developed nations today is slowing population growth in
                     already living beyond the planet’s means to support us sus-  accord with the demographic transition model. However,
                     tainably. One recent analysis concludes that humanity’s global   nations where the human immunodeficiency virus (HIV) and
                     ecological footprint surpassed Earth’s capacity to support us in   acquired immunodeficiency syndrome (AIDS) has taken hold
                     1971 and that our species is now living 50% beyond its means   are not following Notestein’s script. Instead, in these countries
                     (Figure 8.23). This is our overshoot (see Figure 1.4, p. 23). In   death rates have increased, presenting a scenario more akin to
                     this analysis, our ecological footprint can be compared to the   Malthus’s fears.
                     amount of biologically productive land and sea available to   The AIDS epidemic (Figure 8.25) is having the greatest
                     us—an amount termed biocapacity. For any given area, if the   impact on human populations of any communicable disease
                     footprint is greater than the biocapacity, there is an “ecological   since the Black Death killed roughly one-third of Europe’s
                     deficit.” If the footprint is less than the biocapacity, there is an   population in the 14th century and since smallpox and other
                     “ecological reserve.” Because our footprint exceeds our bioca-  diseases brought by Europeans to the New World wiped out
                     pacity by 50% worldwide, we are running a global ecological   likely millions of Native Americans.
                     deficit, gradually draining our planet of its natural capital and   Africa is being hit hardest. Of the world’s 34 million
                     its long-term ability to support our civilization.   people infected with HIV/AIDS as of 2012, two-thirds live in
                         The richest one-fifth of the world’s people possesses over   sub-Saharan Africa. Because HIV is spread by the exchange
                     80 times the income of the poorest one-fifth (Figure 8.24). The   of bodily fluids during sexual contact, the low rate of con-
             226     richest one-fifth also uses 86% of the world’s resources. That   traceptive use that contributes to this region’s high TFR also


           M08_WITH7428_05_SE_C08.indd   226                                                                                    12/12/14   2:58 PM