
Page 630 - Environment: The Science Behind the Stories
P. 630
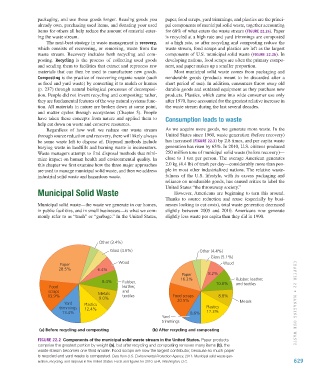
packaging, and use those goods longer. Reusing goods you   paper, food scraps, yard trimmings, and plastics are the princi-
                        already own, purchasing used items, and donating your used   pal components of municipal solid waste, together accounting
                        items for others all help reduce the amount of material enter-  for 68% of what enters the waste stream (FIGURE 22.2a). Paper
                        ing the waste stream.                                is recycled at a high rate and yard trimmings are composted
                            The next-best strategy in waste management is recovery,   at a high rate, so after recycling and composting reduce the
                        which consists of recovering, or removing, waste from the   waste stream, food scraps and plastics are left as the largest
                        waste stream. Recovery includes both recycling and com-  components of U.S. municipal solid waste (FIGURE 22.2b). In
                        posting.  Recycling is the process of collecting used goods   developing nations, food scraps are often the primary compo-
                        and sending them to facilities that extract and reprocess raw   nent, and paper makes up a smaller proportion.
                        materials that can then be used to manufacture new goods.   Most municipal solid waste comes from packaging and
                        Composting is the practice of recovering organic waste (such   nondurable goods (products meant to be discarded after a
                        as food and yard waste) by converting it to mulch or humus    short period of use). In addition, consumers throw away old
                        (p. 237) through natural biological processes of decomposi-  durable goods and outdated equipment as they purchase new
                        tion. People did not invent recycling and composting; rather,   products. Plastics, which came into wide consumer use only
                        they are fundamental features of the way natural systems func-  after 1970, have accounted for the greatest relative increase in
                        tion. All materials in nature are broken down at some point,   the waste stream during the last several decades.
                        and matter cycles  through ecosystems (Chapter  5). People
                        have taken these concepts from nature and applied them to   Consumption leads to waste
                        help cut down on waste and conserve resources.
                            Regardless of how well we reduce our waste stream   As we acquire more goods, we generate more waste. In the
                        through source reduction and recovery, there will likely always   United States since 1960, waste generation (before recovery)
                        be some waste left to dispose of. Disposal methods include   has increased (FIGURE 22.3) by 2.8 times, and per capita waste
                        burying waste in landfills and burning waste in incinerators.   generation has risen by 65%. In 2010, U.S. citizens produced
                        Waste managers attempt to find disposal methods that mini-  250 million tons of municipal solid waste (before recovery)—
                        mize impact on human health and environmental quality. In   close to 1 ton per person. The average American generates
                        this chapter we first examine how the three major approaches   2.0 kg (4.4 lb) of trash per day—considerably more than peo-
                        are used to manage municipal solid waste, and then we address   ple in most other industrialized nations. The relative waste-
                        industrial solid waste and hazardous waste.          fulness of the U.S. lifestyle, with its excess packaging and
                                                                             reliance on nondurable goods, has caused critics to label the
                                                                             United States “the throwaway society.”
                        Municipal Solid Waste                                    However, Americans are beginning to turn this around.
                                                                             Thanks to source reduction and reuse (especially by busi-
                        Municipal solid waste—the waste we generate in our homes,   nesses looking to cut costs), total waste generation decreased
                        in public facilities, and in small businesses—is what we com-  slightly between 2005 and 2010.  Americans now generate
                        monly refer to as “trash” or “garbage.” In the United States,   slightly less waste per capita than they did in 1990.


                                                  Other (3.4%)
                                                      Glass (4.6%)                         Other (4.4%)
                                                                                                Glass (5.1%)
                                                          Wood                                       Wood
                                  Paper
                                 28.5%           6.4%
                                                                                    Paper      8.2%
                                                                                   16.2%                  Rubber, leather,
                                                   8.4%    Rubber,                                10.8%   and textiles
                             Food                          leather,
                             scraps                        and
                             13.9%               Metals    textiles             Food scraps        8.8%
                                                  9.0%
                                   Yard     Plastics                              20.5%                     Metals                CHAPTER 22 • MAN A GING OUR WASTE
                                 trimmings  12.4%                                             Plastics
                                  13.4%                                                8.6%   17.3%
                                                                            Yard
                                                                            trimmings
                         (a) Before recycling and composting            (b) After recycling and composting

                        FIGURE 22.2  Components of the municipal solid waste stream in the United States. Paper products
                        comprise the greatest portion by weight (a), but after recycling and composting removes many items (b), the
                        waste stream becomes one-third smaller. Food scraps are now the largest contributor, because so much paper
                        is recycled and yard waste is composted. Data from U.S. Environmental Protection Agency, 2011. Municipal solid waste gen-
                        eration, recycling, and disposal in the United States: Facts and figures for 2010. EPA, Washington, D.C.  629


           M22_WITH7428_05_SE_C22.indd   629                                                                                    13/12/14   2:25 PM