
Page 631 - Environment: The Science Behind the Stories
P. 631
300 5
Total U.S. generation (millions of tons/year) 200 Total waste waste generation 3 Per capita MSW generation (kg/person/day)
250
4
generation
150
2
100
Per capita
1
50
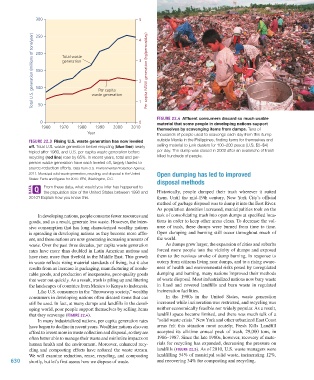
FIGURE 22.4 Affluent consumers discard so much usable
0 0 material that some people in developing nations support
1960 1970 1980 1990 2000 2010 themselves by scavenging items from dumps. Tens of
Year thousands of people used to scavenge each day from this dump
FIGURE 22.3 Rising U.S. waste generation has now leveled outside Manila in the Philippines, finding items for themselves and
off. Total U.S. waste generation before recycling (blue line) nearly selling material to junk dealers for 100–200 pesos (U.S. $2–$4)
tripled after 1960, and U.S. per capita waste generation before per day. The dump was closed in 2000 after an avalanche of trash
recycling (red line) rose by 65%. In recent years, total and per- killed hundreds of people.
person waste generation have each leveled off, largely thanks to
source-reduction efforts. Data from U.S. Environmental Protection Agency,
2011. Municipal solid waste generation, recycling, and disposal in the United Open dumping has led to improved
States: Facts and figures for 2010. EPA, Washington, D.C.
disposal methods
From these data, what would you infer has happened to
the population size of the United States between 1990 and Historically, people dumped their trash wherever it suited
2010? Explain how you know this. them. Until the mid-19th century, New York City’s official
method of garbage disposal was to dump it into the East River.
As population densities increased, municipalities took on the
In developing nations, people consume fewer resources and task of consolidating trash into open dumps at specified loca-
goods, and as a result, generate less waste. However, the inten- tions in order to keep other areas clean. To decrease the vol-
sive consumption that has long characterized wealthy nations ume of trash, these dumps were burned from time to time.
is spreading in developing nations as they become more afflu- Open dumping and burning still occur throughout much of
ent, and these nations are now generating increasing amounts of the world.
waste. Over the past three decades, per capita waste generation As dumps grew larger, the expansion of cities and suburbs
rates have more than doubled in Latin American nations and forced more people into the vicinity of dumps and exposed
have risen more than fivefold in the Middle East. This growth them to the noxious smoke of dump burning. In response to
in waste reflects rising material standards of living, but it also outcry from citizens living near dumps, and to a rising aware-
results from an increase in packaging, manufacturing of nondu- ness of health and environmental risks posed by unregulated
rable goods, and production of inexpensive, poor-quality goods dumping and burning, many nations improved their methods
that wear out quickly. As a result, trash is piling up and littering of waste disposal. Most industrialized nations now bury waste
the landscapes of countries from Mexico to Kenya to Indonesia. in lined and covered landfills and burn waste in regulated
Like U.S. consumers in the “throwaway society,” wealthy incineration facilities.
consumers in developing nations often discard items that can In the 1980s in the United States, waste generation
still be used. In fact, at many dumps and landfills in the devel- increased while incineration was restricted, and recycling was
oping world, poor people support themselves by selling items neither economically feasible nor widely popular. As a result,
that they scavenge (FIGURE 22.4). landfill space became limited, and there was much talk of a
In many industrialized nations, per capita generation rates “solid waste crisis.” New York and other urbanized East Coast
have begun to decline in recent years. Wealthier nations also can areas felt this situation most acutely; Fresh Kills Landfill
afford to invest more in waste collection and disposal, so they are accepted its all-time annual peak of trash, 29,000 tons, in
often better able to manage their waste and minimize impacts on 1986–1987. Since the late 1980s, however, recovery of mate-
human health and the environment. Moreover, enhanced recy- rials for recycling has expanded, decreasing the pressure on
cling and composting efforts have reduced the waste stream. landfills (FIGURE 22.5). As of 2010, U.S. waste managers were
We will examine reduction, reuse, recycling, and composting landfilling 54% of municipal solid waste, incinerating 12%,
630 shortly, but let’s first assess how we dispose of waste. and recovering 34% for composting and recycling.
M22_WITH7428_05_SE_C22.indd 630 13/12/14 2:25 PM