Page 637 - Environment: The Science Behind the Stories
P. 637

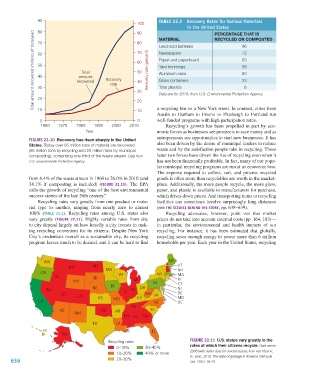
90                                                TABLE 22.2   Recovery Rates for Various Materials
                                                                 100
                                                                                      in the United States   96
                        80
                       Total amount recovered (millions of tons/year)  60  recovered  Recovery  70 Recovery rate (percent)  Newspapers  72
                                                                 90
                                                                                                 PERCENTAGE THAT IS

                                                                                                 RECYCLED OR COMPOSTED
                                                                          MATERIAL
                        70
                                                                 80
                                                                          Lead-acid batteries
                                                                                                             63
                                                                          Paper and paperboard
                                                                 60
                        50
                                                                                                             58
                                                                          Yard trimmings
                                                                 50
                                          Total
                                                                                                             50
                                                                          Aluminum cans
                        40
                                         amount
                                                                          Glass containers
                                                                                                             33
                                                                 40
                                                      rate
                                                                          Total plastics
                                                                                                              8
                        30
                                                                 30
                                                                          Data are for 2010, from U.S. Environmental Protection Agency.
                        20
                                                                 20
                                                                          a recycling bin on a New York street. In contrast, cities from
                        10
                                                                 10
                                                                          Austin to Durham to Fresno to Pittsburgh to Portland run
                         0                                        0       well-funded programs with high participation rates.
                          1960   1970   1980    1990   2000   2010           Recycling’s growth has been propelled in part by eco-
                                            Year                          nomic forces as businesses see prospects to save money and as
                     FIGURE 22.10  Recovery has risen sharply in the United   entrepreneurs see opportunities to start new businesses. It has
                     States. Today over 85 million tons of material are recovered    also been driven by the desire of municipal leaders to reduce
                     (65 million tons by recycling and 20 million tons by municipal   waste and by the satisfaction people take in recycling. These
                     composting), comprising one-third of the waste stream. Data from   latter two forces have driven the rise of recycling even when it
                     U.S. Environmental Protection Agency.                has not been financially profitable. In fact, many of our popu-
                                                                          lar municipal recycling programs are run at an economic loss.
                                                                          The expense required to collect, sort, and process recycled
                     from 6.4% of the waste stream in 1960 to 26.0% in 2010 (and   goods is often more than recyclables are worth in the market-
                     34.1% if composting is included) (FIGURE 22.10). The  EPA   place. Additionally, the more people recycle, the more glass,
                     calls the growth of recycling “one of the best environmental   paper, and plastic is available to manufacturers for purchase,
                     success stories of the late 20th century.”           which drives down prices. And transporting items to recycling
                        Recycling rates vary greatly from one product or mate-  facilities can sometimes involve surprisingly long distances
                     rial type to another, ranging from nearly zero to almost   (see THE SCIENCE BEHIND THE STORY, pp. 638–639).
                     100% (TABLE 22.2). Recycling rates among U.S. states also   Recycling advocates, however, point out that market
                     vary  greatly (FIGURE 22.11).  Highly variable  rates  from city   prices do not take into account external costs (pp. 164, 183)—
                     to city depend largely on how heavily a city invests in mak-  in particular, the environmental and health impacts of  not
                     ing recycling convenient for its citizens. Despite New York   recycling. For instance, it has been estimated that globally,
                     City’s credentials overall as a sustainable city, its recycling   recycling saves enough energy to power more than 6 million
                     program leaves much to be desired, and it can be hard to find   households per year. Each year in the United States, recycling
                           WA                                                 ME
                                     MT        ND   MN                            VT
                                                                                  NH
                          OR                              WI              NY      MA
                               ID              SD
                                       WY                       MI      PA        RI
                                                                                  CT
                            NV                 NE      IA   IL  IN  OH            NJ
                                  UT     CO                          WV  VA       DE
                                         CO
                        CA                       KS     MO       KY     NC        MD
                                                                                  DC
                                                               TN
                                 AZ               OK    AR             SC
                                        NM
                                                            MS AL   GA
                                               TX        LA
                           HI                                          FL
                                  AK
                                                     Recycling rates                   FIGURE 22.11  U.S. states vary greatly in the
                                                         0–10%       30–40%            rates at which their citizens recycle. Data are for
                                                         10–20%      40% or more       2008 (with earlier data for several states), from van Haaren,
                                                                                       R., et al., 2010. The state of garbage in America. BioCycle
             636                                         20–30%                        Oct. 2010: 16–23.


           M22_WITH7428_05_SE_C22.indd   636                                                                                    13/12/14   2:25 PM
   632   633   634   635   636   637   638   639   640   641   642