
Page 83 - Environment: The Science Behind the Stories
P. 83
tHE sCIENCE BEHINd tHE stoRy
Monitoring Bird time and determines a straight line that
Populations at can be drawn through them to most
accurately represent their trend. Linear
Hakalau Forest regression thus places a “line of best
fit” through the data points on a graph
Are populations of honeycreepers (see Figure 1).
increasing or decreasing? It’s a high- With the data from Hakalau, linear
stakes question. The answer could regression led managers to conclude
tell us whether management efforts that over the 21-year period:
to save them are on the right track, or
whether the birds may be headed for • In high-elevation pasture that
extinction. managers were restoring to forest,
At Hakalau Forest National Wildlife populations of birds that used the
Refuge, on the rainy slope of Mauna young trees were rising sharply.
Kea on the island of Hawai‘i, biolo- • In middle-elevation open forest
gists have been working hard for years being managed, populations of all
to understand the dynamics of bird native birds were either stable or
populations. But monitoring popula- Jack Jeffrey in the hakalau Forest increasing.
tion trends is not easy, and there is still The long-term picture thus appeared
debate and uncertainty. bright.
Established in 1985, the Hakalau species seen or heard. With 343
Refuge is home to nine species of points along 15 transects across the
native forest birds, including four refuge, this sampling allowed them 5
federally endangered ones: the Hawai‘i to estimate population densities for
‘aˉ kepa, the Hawai‘i creeper, the each bird species. Researchers then 4
‘akiapoˉ laˉ ‘au, and the ‘io, or Hawaiian analyzed changes in these samples
hawk. A number of non-native birds through time to make inferences 3
now occur here as well. Much of the about changes in population densities `Elepaio density
region’s native forest had been cleared and population sizes. 2
for cattle ranching years ago, while After 21 years of point counts, 1
free-roaming pigs and invasive plants refuge biologists summarized their
had degraded the rest. analyses. At a 2008 workshop and in 0
The biologists employed after 1985 a 2009 technical report, they con-
to manage Hakalau fenced pigs and cluded that populations of most native 1985 1990 1995 2000 2005 2010
feral cattle out of the forest and labored birds were either stable or slowly Year
to restore the area by removing invasive increasing across most of the refuge.
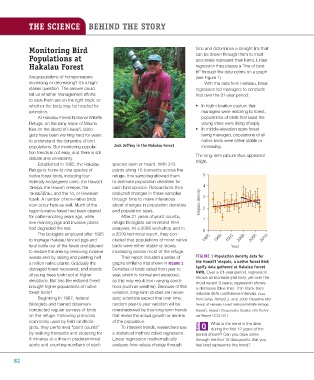
weeds and by raising and planting half Their report included a series of Figure 1 population density data for
a million native plants. Gradually the graphs similar to that shown in Figure 1. the hawai‘i ‘elepaio, a native forest bird,
damaged forest recovered, and stands Densities of birds varied from year to typify data gathered at hakalau Forest
of young trees took root at higher year, which is normal and expected, nWr. Over a 21-year period, regression
shows an increase (red line), yet over the
elevations. But has the restored forest as this may result from varying condi- most recent 9 years, regression shows
brought higher populations of native tions (such as weather). Because of this a decrease (blue line). Thin black bars
forest birds? variation, long-term studies are neces- indicate 95% confidence intervals. Data
Beginning in 1987, federal sary; scientists expect that over time, from Camp, Richard J., et al. 2009. Passerine bird
biologists and trained observers random year-to-year variation will be trends at Hakalau Forest National Wildlife Refuge,
conducted regular surveys of birds overshadowed by true long-term trends Hawai‘i. Hawai‘i Cooperative Studies Unit Techni-
on the refuge. Following protocols that reveal the actual growth or decline cal Report HCSU-011.
commonly used by field ornitholo- of the population. What is the trend in the data
gists, they performed “point counts” To interpret trends, researchers use during the first 12 years of the
by walking transects and stopping for a statistical method called regression. period shown? Can you draw a line
8 minutes at a time in predetermined Linear regression mathematically through the first 12 data points that you
spots and counting numbers of each analyzes how values change through feel best represents this trend?
82
M03_WITH7428_05_SE_C03.indd 82 12/12/14 2:54 PM