
Page 642 - Basic College Mathematics with Early Integers
P. 642
CUMULATIVE REVIEW 619
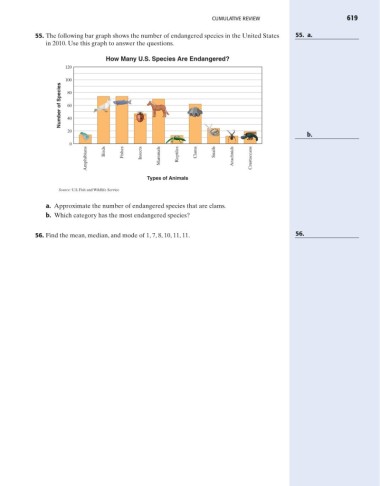
55. The following bar graph shows the number of endangered species in the United States 55. a.
in 2010. Use this graph to answer the questions.
How Many U.S. Species Are Endangered?
120
100
Number of Species 80
60
40
20
b.
0
Amphibians Birds Fishes Insects Mammals Reptiles Clams Snails Arachnids Crustaceans
Types of Animals
Source: U.S. Fish and Wildlife Service
a. Approximate the number of endangered species that are clams.
b. Which category has the most endangered species?
56. Find the mean, median, and mode of 1, 7, 8, 10, 11, 11. 56.