
Page 299 - Basic Electrical Engineering
P. 299
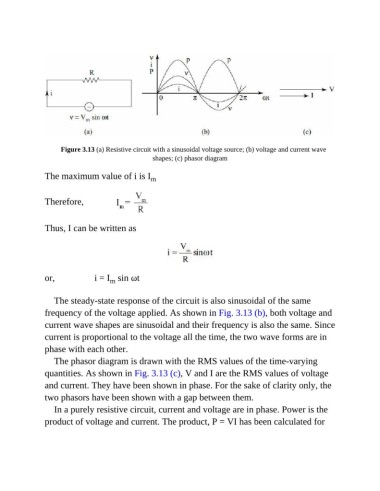
Figure 3.13 (a) Resistive circuit with a sinusoidal voltage source; (b) voltage and current wave
                                                  shapes; (c) phasor diagram


               The maximum value of i is I        m


               Therefore,


               Thus, I can be written as


               or,                 i = I  sin ωt
                                    m


                  The steady-state response of the circuit is also sinusoidal of the same
               frequency of the voltage applied. As shown in Fig. 3.13 (b), both voltage and

               current wave shapes are sinusoidal and their frequency is also the same. Since
               current is proportional to the voltage all the time, the two wave forms are in

               phase with each other.
                  The phasor diagram is drawn with the RMS values of the time-varying
               quantities. As shown in Fig. 3.13 (c), V and I are the RMS values of voltage

               and current. They have been shown in phase. For the sake of clarity only, the
               two phasors have been shown with a gap between them.

                  In a purely resistive circuit, current and voltage are in phase. Power is the
               product of voltage and current. The product, P = VI has been calculated for