
Page 427 - Using MIS
P. 427
Q2 How Big Is the Computer Security Problem? 395
Q2 How Big Is the Computer Security Problem?
We do not know the full extent of the financial and data losses due to computer security threats.
Certainly, the losses due to human error are enormous, but few organizations compute those
losses, and even fewer publish them. However, a recent security report by Verizon called 2013
“year of the retailer breach.” The number of user accounts stolen by hackers included Adobe
150 million, Target Corp. 98 million, LivingSocial 50 million, Evernote 50 million, Korea Credit
Bureau 20 million, Facebook 6 million, Schnuck Markets 2.4 million, Vodafone 2 million, and
2
Neiman Marcus 1.1 million. These are only the companies that made the news and reported
estimated losses.
Losses due to natural disasters are also enormous and impossible to compute. The 2011
earthquake in Japan, for example, shut down Japanese manufacturing, and losses rippled
through the supply chain from the Far East to Europe and the United States. One can only imag-
ine the enormous expense for Japanese companies as they restored their information systems.
Furthermore, no one knows the cost of computer crime. For one, there are no standards for
tallying crime costs. Does the cost of a denial-of-service attack include lost employee time, lost
revenue, or long-term revenue losses due to lost customers? Or, if an employee loses a $2,000
laptop, does the cost include the value of the data that was on it? Does it include the cost of the
time of replacing it and reinstalling software? Or, if someone steals next year’s financial plan,
how is the cost of the value that competitors glean determined?
Second, all the studies on the cost of computer crime are based on surveys. Different re-
spondents interpret terms differently, some organizations don’t report all their losses, and some
won’t report computer crime losses at all. Absent standard definitions and a more accurate way
of gathering crime data, we cannot rely on the accuracy of any particular estimate. The most we
can do is look for trends by comparing year-to-year data, assuming the same methodology is
used by the various types of survey respondents.
3
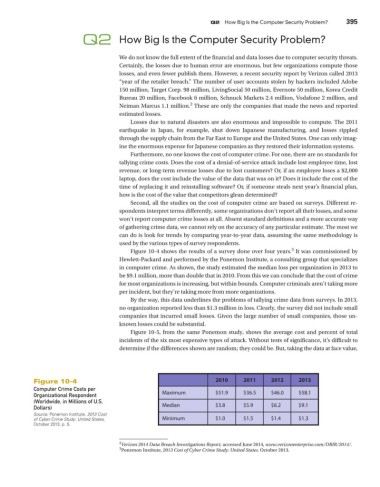
Figure 10-4 shows the results of a survey done over four years. It was commissioned by
Hewlett-Packard and performed by the Ponemon Institute, a consulting group that specializes
in computer crime. As shown, the study estimated the median loss per organization in 2013 to
be $9.1 million, more than double that in 2010. From this we can conclude that the cost of crime
for most organizations is increasing, but within bounds. Computer criminals aren’t taking more
per incident, but they’re taking more from more organizations.
By the way, this data underlines the problems of tallying crime data from surveys. In 2013,
no organization reported less than $1.3 million in loss. Clearly, the survey did not include small
companies that incurred small losses. Given the large number of small companies, those un-
known losses could be substantial.
Figure 10-5, from the same Ponemon study, shows the average cost and percent of total
incidents of the six most expensive types of attack. Without tests of significance, it’s difficult to
determine if the differences shown are random; they could be. But, taking the data at face value,
Figure 10-4 2010 2011 2012 2013
Computer Crime Costs per Maximum $51.9 $36.5 $46.0 $58.1
Organizational Respondent
(Worldwide, in Millions of U.S.
Dollars) Median $3.8 $5.9 $6.2 $9.1
Source: Ponemon Institute. 2013 Cost
of Cyber Crime Study: United States, Minimum $1.0 $1.5 $1.4 $1.3
October 2013, p. 5.
2 Verizon 2014 Data Breach Investigations Report, accessed June 2014, www.verizonenterprise.com/DBIR/2014/.
3 Ponemon Institute, 2013 Cost of Cyber Crime Study: United States. October 2013.