
Page 428 - Using MIS
P. 428
396 Chapter 10 Information Systems Security
2010 2011 2012 2013
Denial of Service NA $187,506 $172,238 $243,913
(17%) (20%) (21%)
Malicious Insiders $100,300 $105,352 $166,251 $198,769
(11%) (9%) (8%) (8%)
Web-based Attacks $143,209 $141,647 $125,795 $125,101
(15%) (12%) (13%) (12%)
Malicious Code $124,083 $126,787 $109,533 $102,216
(26%) (23%) (26%) (21%)
Figure 10-5
Average Computer Crime Cost Phishing and Social $35,514 $30,397 $18,040 $21,094
and Percent of Attacks by Type Engineering (12%) (9%) (7%) (11%)
(6 Most Expensive Types)
Source: Ponemon Institute. 2013 Cost Stolen Devices $25,663 $24,968 $23,541 $20,070
of Cyber Crime Study: United States, (17%) (13%) (12%) (9%)
October 2013, p. 12.
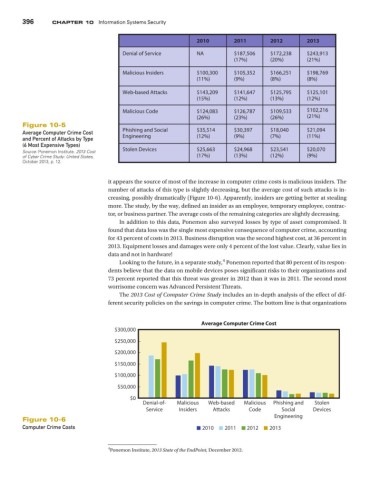
it appears the source of most of the increase in computer crime costs is malicious insiders. The
number of attacks of this type is slightly decreasing, but the average cost of such attacks is in-
creasing, possibly dramatically (Figure 10-6). Apparently, insiders are getting better at stealing
more. The study, by the way, defined an insider as an employee, temporary employee, contrac-
tor, or business partner. The average costs of the remaining categories are slightly decreasing.
In addition to this data, Ponemon also surveyed losses by type of asset compromised. It
found that data loss was the single most expensive consequence of computer crime, accounting
for 43 percent of costs in 2013. Business disruption was the second highest cost, at 36 percent in
2013. Equipment losses and damages were only 4 percent of the lost value. Clearly, value lies in
data and not in hardware!
4
Looking to the future, in a separate study, Ponemon reported that 80 percent of its respon-
dents believe that the data on mobile devices poses significant risks to their organizations and
73 percent reported that this threat was greater in 2012 than it was in 2011. The second most
worrisome concern was Advanced Persistent Threats.
The 2013 Cost of Computer Crime Study includes an in-depth analysis of the effect of dif-
ferent security policies on the savings in computer crime. The bottom line is that organizations
Average Computer Crime Cost
$300,000
$250,000
$200,000
$150,000
$100,000
$50,000
$0
Denial-of- Malicious Web-based Malicious Phishing and Stolen
Service Insiders Attacks Code Social Devices
Engineering
Figure 10-6
Computer Crime Costs 2010 2011 2012 2013
4 Ponemon Institute, 2013 State of the EndPoint, December 2012.