Page 346 - Fiber Optic Communications Fund
P. 346

Transmission System Design                                                         327


              1.4                                        2.5

              1.2
                                                          2
               1
                                                         1.5
              0.8
            Current, I  0.6                             Current, I  1


              0.4
                                                         0.5
              0.2
               0                                          0
                        –0.5       0       0.5       1             –0.5      0        0.5       1
                                Time (s)         x 10 –10                  Time (s)         x 10 –10
                                  (a)                                        (b)

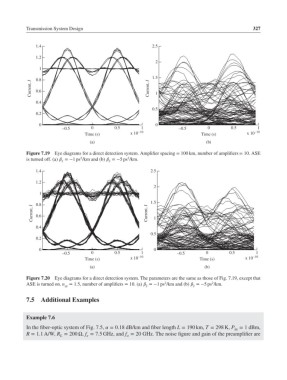
           Figure 7.19  Eye diagrams for a direct detection system. Amplifier spacing = 100 km, number of amplifiers = 10. ASE
                               2
                                                2
           is turned off. (a)  =−1ps /km and (b)  =−5ps /km.
                                         2
                        2
              1.4                                       2.5
              1.2
                                                          2
               1
                                                        1.5
              0.8
             Current, I  0.6                           Current, I  1


              0.4
                                                        0.5
              0.2

               0                                          0
                        –0.5       0       0.5       1            –0.5       0       0.5       1
                                Time (s)         x 10 –10                 Time (s)         x 10 –10
                                  (a)                                       (b)
           Figure 7.20  Eye diagrams for a direct detection system. The parameters are the same as those of Fig. 7.19, except that
                                                             2
                                                                               2
           ASE is turned on. n = 1.5, number of amplifiers = 10. (a)  =−1ps /km and (b)  =−5ps /km.
                                                       2
                                                                        2
                         sp
           7.5  Additional Examples
           Example 7.6

           In the fiber-optic system of Fig. 7.5,  = 0.18 dB/km and fiber length L = 190 km, T = 298 K, P = 1dBm,
                                                                                       in
           R = 1.1A/W, R = 200 Ω, f = 7.5 GHz, and f = 20 GHz. The noise figure and gain of the preamplifier are
                                 e
                       L
                                                o
   341   342   343   344   345   346   347   348   349   350   351