
Page 345 - Fiber Optic Communications Fund
P. 345
326 Fiber Optic Communications
7.4.5 Numerical Experiments
Consider a 10-Gb/s fiber-optic direct detection system based on OOK. The schematic of the system is shown
in Fig. 7.13. We assume that the gains of the amplifiers are identical and fiber lengths are the same. Let
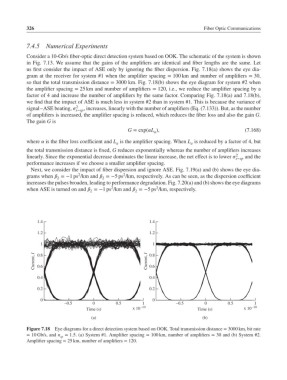
us first consider the impact of ASE only by ignoring the fiber dispersion. Fig. 7.18(a) shows the eye dia-
gram at the receiver for system #1 when the amplifier spacing = 100 km and number of amplifiers = 30,
so that the total transmission distance = 3000 km. Fig. 7.18(b) shows the eye diagram for system #2 when
the amplifier spacing = 25 km and number of amplifiers = 120, i.e., we reduce the amplifier spacing by a
factor of 4 and increase the number of amplifiers by the same factor. Comparing Fig. 7.18(a) and 7.18(b),
we find that the impact of ASE is much less in system #2 than in system #1. This is because the variance of
signal–ASE beating, 2 s−sp , increases, linearly with the number of amplifiers (Eq. (7.133)). But, as the number
of amplifiers is increased, the amplifier spacing is reduced, which reduces the fiber loss and also the gain G.
The gain G is
G = exp(L ), (7.168)
a
where is the fiber loss coefficient and L is the amplifier spacing. When L is reduced by a factor of 4, but
a a
the total transmission distance is fixed, G reduces exponentially whereas the number of amplifiers increases
linearly. Since the exponential decrease dominates the linear increase, the net effect is to lower 2 and the
s−sp
performance increases if we choose a smaller amplifier spacing.
Next, we consider the impact of fiber dispersion and ignore ASE. Fig. 7.19(a) and (b) shows the eye dia-
2
2
grams when =−1ps /km and =−5ps /km, respectively. As can be seen, as the dispersion coefficient
2 2
increases the pulses broaden, leading to performance degradation. Fig. 7.20(a) and (b) shows the eye diagrams
2
2
when ASE is turned on and =−1ps /km and =−5ps /km, respectively.
2 2
1.4 1.4
1.2 1.2
1 1
Current, I 0.8 Current, I 0.8
0.6
0.6
0.4 0.4
0.2 0.2
0 0
–0.5 0 0.5 1 –0.5 0 0.5 1
Time (s) x 10 –10 Time (s) x 10 –10
(a) (b)
Figure 7.18 Eye diagrams for a direct detection system based on OOK. Total transmission distance = 3000 km, bit rate
= 10 Gb/s, and n = 1.5. (a) System #1. Amplifier spacing = 100 km, number of amplifiers = 30 and (b) System #2.
sp
Amplifier spacing = 25 km, number of amplifiers = 120.