
Page 396 - Fiber Optic Communications Fund
P. 396
Performance Analysis 377
t = T b
'
H 1 (ω) PD1
s'(t)e *iω c t |∙| 2 I 1 (T b )
+ If I 1 (T b ) > I 0 (T b )
Tx ∑ Comparator select ‘1’
otherwise,
+ t = T b select ‘0’
'
H (ω) PD0
0
n c (t)e *iω c t |∙| 2 I 0 (T b )
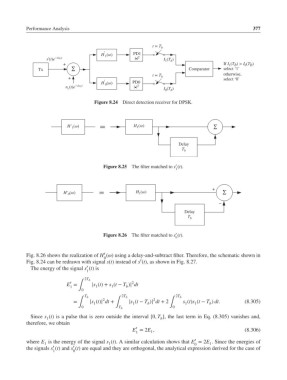
Figure 8.24 Direct detection receiver for DPSK.
H' 1 (ω) H 1 (ω) ∑
Delay
T b
′
Figure 8.25 The filter matched to s (t).
1
+
(ω) H 1 (ω) ∑
H' 0
*
Delay
T b
′
Figure 8.26 The filter matched to s (t).
0
′
Fig. 8.26 shows the realization of H () using a delay-and-subtract filter. Therefore, the schematic shown in
0
′
Fig. 8.24 can be redrawn with signal s(t) instead of s (t), as shown in Fig. 8.27.
′
The energy of the signal s (t) is
1
2T b
2
′
E = |s (t)+ s (t − T )| dt
1 ∫ 1 1 b
0
T b 2T b 2T b
2
2
= |s (t)| dt + |s (t − T )| dt + 2 s (t)s (t − T ) dt. (8.305)
∫ 1 ∫ 1 b ∫ 1 1 b
0 T b 0
Since s (t) is a pulse that is zero outside the interval [0, T ], the last term in Eq. (8.305) vanishes and,
b
1
therefore, we obtain
′
E = 2E , (8.306)
1 1
′
where E is the energy of the signal s (t). A similar calculation shows that E = 2E . Since the energies of
1
1
1
0
′
′
the signals s (t) and s (t) are equal and they are orthogonal, the analytical expression derived for the case of
1 0