
Page 86 - Introduction to Business
P. 86
60 PART 1 The Nature of Contemporary Business
production. Despite the fact that Brazil has an absolute advantage over the United
States in the production of both coffee and corn, free trade will ensure that both
countries will have a higher standard of living if Brazil concentrates its efforts in the
production of coffee and the United States utilizes its resources in corn production.
A country has a comparative advantage in the production of a good or service when
it has the greater advantage over another country. It is important to remember that
resources in all countries are scarce. That is why countries must choose the most
efficient use of their scare resources. When all countries specialize in the produc-
tion of the goods and services in which they enjoy a comparative advantage, they
not only use their resources most efficiently, but they also increase the total output
and welfare of the world!
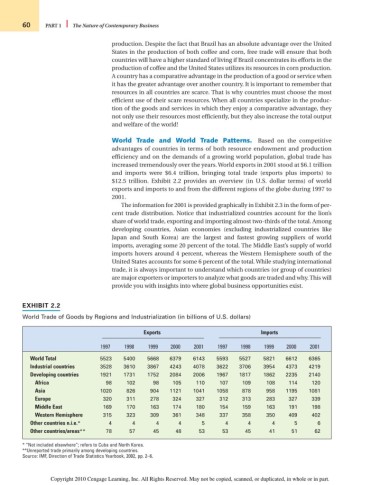
World Trade and World Trade Patterns. Based on the competitive
advantages of countries in terms of both resource endowment and production
efficiency and on the demands of a growing world population, global trade has
increased tremendously over the years. World exports in 2001 stood at $6.1 trillion
and imports were $6.4 trillion, bringing total trade (exports plus imports) to
$12.5 trillion. Exhibit 2.2 provides an overview (in U.S. dollar terms) of world
exports and imports to and from the different regions of the globe during 1997 to
2001.
The information for 2001 is provided graphically in Exhibit 2.3 in the form of per-
cent trade distribution. Notice that industrialized countries account for the lion’s
share of world trade, exporting and importing almost two-thirds of the total. Among
developing countries, Asian economies (excluding industrialized countries like
Japan and South Korea) are the largest and fastest growing suppliers of world
imports, averaging some 20 percent of the total. The Middle East’s supply of world
imports hovers around 4 percent, whereas the Western Hemisphere south of the
United States accounts for some 6 percent of the total. While studying international
trade, it is always important to understand which countries (or group of countries)
are major exporters or importers to analyze what goods are traded and why. This will
provide you with insights into where global business opportunities exist.
EXHIBIT 2.2
World Trade of Goods by Regions and Industrialization (in billions of U.S. dollars)
Exports Imports
1997 1998 1999 2000 2001 1997 1998 1999 2000 2001
World Total 5523 5400 5668 6379 6143 5593 5527 5821 6612 6365
Industrial countries 3528 3610 3867 4243 4078 3622 3706 3954 4373 4219
Developing countries 1921 1731 1752 2084 2006 1967 1817 1862 2235 2140
Africa 98 102 98 105 110 107 109 108 114 120
Asia 1020 826 904 1121 1041 1058 878 958 1195 1081
Europe 320 311 278 324 327 312 313 283 327 339
Middle East 169 170 163 174 180 154 159 163 191 198
Western Hemisphere 315 323 309 361 348 337 358 350 409 402
Other countries n.i.e.* 4 4 4 4 5 4 4 4 5 6
Other countries/areas** 78 57 45 48 53 53 45 41 51 62
* “Not included elsewhere”; refers to Cuba and North Korea.
**Unreported trade primarily among developing countries.
Source: IMF, Direction of Trade Statistics Yearbook, 2002, pp. 2–6.
Copyright 2010 Cengage Learning, Inc. All Rights Reserved. May not be copied, scanned, or duplicated, in whole or in part.