
Page 97 - Introduction to Business
P. 97
CHAPTER 2 The Environment of Business 71
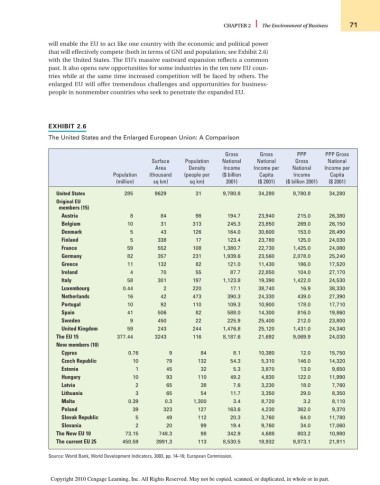
will enable the EU to act like one country with the economic and political power
that will effectively compete (both in terms of GNI and population; see Exhibit 2.6)
with the United States. The EU’s massive eastward expansion reflects a common
past. It also opens new opportunities for some industries in the ten new EU coun-
tries while at the same time increased competition will be faced by others. The
enlarged EU will offer tremendous challenges and opportunities for business-
people in nonmember countries who seek to penetrate the expanded EU.
EXHIBIT 2.6
The United States and the Enlarged European Union: A Comparison
Gross Gross PPP PPP Gross
Surface Population National National Gross National
Area Density Income Income per National Income per
Population (thousand (people per ($ billion Capita Income Capita
(million) sq km) sq km) 2001) ($ 2001) ($ billion 2001) ($ 2001)
United States 285 9629 31 9,780.8 34,280 9,780.8 34,280
Original EU
members (15)
Austria 8 84 98 194.7 23,940 215.0 26,380
Belgium 10 31 313 245.3 23,850 269.0 26,150
Denmark 5 43 126 164.0 30,600 153.0 28,490
Finland 5 338 17 123.4 23,780 125.0 24,030
France 59 552 108 1,380.7 22,730 1,425.0 24,080
Germany 82 357 231 1,939.6 23,560 2,078.0 25,240
Greece 11 132 82 121.0 11,430 186.0 17,520
Ireland 4 70 55 87.7 22,850 104.0 27,170
Italy 58 301 197 1,123.8 19,390 1,422.0 24,530
Luxembourg 0.44 2 220 17.1 38,740 16.9 38,330
Netherlands 16 42 473 390.3 24,330 439.0 27,390
Portugal 10 92 110 109.3 10,900 178.0 17,710
Spain 41 506 82 588.0 14,300 816.0 19,860
Sweden 9 450 22 225.9 25,400 212.0 23,800
United Kingdom 59 243 244 1,476.8 25,120 1,431.0 24,340
The EU 15 377.44 3243 116 8,187.6 21,692 9,069.9 24,030
New members (10)
Cyprus 0.76 9 84 8.1 10,380 12.0 15,750
Czech Republic 10 79 132 54.3 5,310 146.0 14,320
Estonia 1 45 32 5.3 3,870 13.0 9,650
Hungary 10 93 110 49.2 4,830 122.0 11,990
Latvia 2 65 38 7.6 3,230 18.0 7,760
Lithuania 3 65 54 11.7 3,350 29.0 8,350
Malta 0.39 0.3 1,300 3.4 8,720 3.2 8,110
Poland 39 323 127 163.6 4,230 362.0 9,370
Slovak Republic 5 49 112 20.3 3,760 64.0 11,780
Slovania 2 20 99 19.4 9,760 34.0 17,060
The New EU 10 73.15 748.3 98 342.9 4,688 803.2 10,980
The current EU 25 450.59 3991.3 113 8,530.5 18,932 9,873.1 21,911
Source: World Bank, World Development Indicators, 2003, pp. 14–16; European Commission.
Copyright 2010 Cengage Learning, Inc. All Rights Reserved. May not be copied, scanned, or duplicated, in whole or in part.