
Page 250 - Essencials of Sociology
P. 250
What Is Social Class? 223
As you can also see from this figure, 1 percent of Americans own more than one-third FIGURE 8.2
of all U.S. assets.
Distribution of the
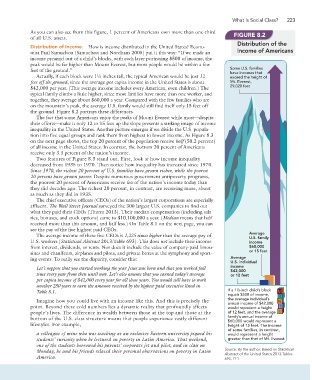
Distribution of Income. How is income distributed in the United States? Econo-
mist Paul Samuelson (Samuelson and Nordhaus 2005) put it this way: “If we made an Income of Americans
income pyramid out of a child’s blocks, with each layer portraying $500 of income, the
peak would be far higher than Mount Everest, but most people would be within a few
Some U.S. families
feet of the ground.”
have incomes that
Actually, if each block were 1½ inches tall, the typical American would be just 12 exceed the height of
feet off the ground, since the average per capita income in the United States is about Mt. Everest,
29,028 feet
$42,000 per year. (This average income includes every American, even children.) The
typical family climbs a little higher, since most families have more than one worker, and
together, they average about $60,000 a year. Compared with the few families who are
on the mountain’s peak, the average U.S. family would still find itself only 15 feet off
the ground. Figure 8.2 portrays these differences.
The fact that some Americans enjoy the peaks of Mount Everest while most—despite
their efforts—make it only 12 to 15 feet up the slope presents a striking image of income
inequality in the United States. Another picture emerges if we divide the U.S. popula-
tion into five equal groups and rank them from highest to lowest income. As Figure 8.3
on the next page shows, the top 20 percent of the population receive half (50.2 percent)
of all income in the United States. In contrast, the bottom 20 percent of Americans
receive only 3.3 percent of the nation’s income.
Two features of Figure 8.3 stand out. First, look at how income inequality
decreased from 1935 to 1970. Then notice how inequality has increased since 1970.
Since 1970, the richest 20 percent of U.S. families have grown richer, while the poorest
20 percent have grown poorer. Despite numerous government antipoverty programs,
the poorest 20 percent of Americans receive less of the nation’s income today than
they did decades ago. The richest 20 percent, in contrast, are receiving more, about
as much as they did in 1935.
The chief executive officers (CEOs) of the nation’s largest corporations are especially
affluent. The Wall Street Journal surveyed the 300 largest U.S. companies to find out
what they paid their CEOs (Thurm 2013). Their median compensation (including sala-
ries, bonuses, and stock options) came to $10,100,000 a year. (Median means that half
received more than this amount, and half less.) On Table 8.1 on the next page, you can
see the pay of the five highest paid CEOs.
Average
The average income of these five CEOs is 1,225 times higher than the average pay of
U.S. family
U.S. workers (Statistical Abstract 2013:Table 693). This does not include their income income
from interest, dividends, or rents. Nor does it include the value of company-paid limou- $60,000
or 15 feet
sines and chauffeurs, airplanes and pilots, and private boxes at the symphony and sport-
ing events. To really see the disparity, consider this: Average
U.S. individual
Let’s suppose that you started working the year Jesus was born and that you worked full income
$42,000
time every year from then until now. Let’s also assume that you earned today’s average or 12 feet
per capita income of $42,000 every year for all those years. You would still have to work
another 250 years to earn the amount received by the highest-paid executive listed in
Table 8.1. If a 1½-inch child’s block
equals $500 of income,
the average individual’s
Imagine how you could live with an income like this. And this is precisely the
annual income of $42,000
point. Beyond these cold numbers lies a dynamic reality that profoundly affects would represent a height
people’s lives. The difference in wealth between those at the top and those at the of 12 feet, and the average
family’s annual income of
bottom of the U.S. class structure means that people experience vastly different
$60,000 would represent a
lifestyles. For example, height of 15 feet. The income
of some families, in contrast,
a colleague of mine who was teaching at an exclusive Eastern university piqued his would represent a height
students’ curiosity when he lectured on poverty in Latin America. That weekend, greater than that of Mt. Everest.
one of the students borrowed his parents’ corporate jet and pilot, and in class on
Monday, he and his friends related their personal observations on poverty in Latin Source: By the author. Based on Statistical
Abstract of the United States 2013:Tables
America. 693, 711.