
Page 251 - Essencials of Sociology
P. 251
224 CHAPTER 8 Social Class in the United States
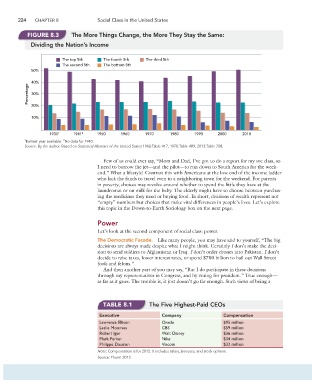
FIGURE 8.3 The More Things Change, the More They Stay the Same:
Dividing the Nation’s Income
The top 5th The fourth 5th The third 5th
The second 5th The bottom 5th
50%
Percentage 40%
30%
20%
10%
1935 1 1941 2 1950 1960 1970 1980 1990 2000 2010
2
1 Earliest year available. No data for 1940.
Source: By the author. Based on Statistical Abstract of the United States 1960:Table 417; 1970:Table 489; 2013:Table 708.
Few of us could ever say, “Mom and Dad, I’ve got to do a report for my soc class, so
I need to borrow the jet—and the pilot—to run down to South America for the week-
end.” What a lifestyle! Contrast this with Americans at the low end of the income ladder
who lack the funds to travel even to a neighboring town for the weekend. For parents
in poverty, choices may revolve around whether to spend the little they have at the
laundromat or on milk for the baby. The elderly might have to choose between purchas-
ing the medicines they need or buying food. In short, divisions of wealth represent not
“empty” numbers but choices that make vital differences in people’s lives. Let’s explore
this topic in the Down-to-Earth Sociology box on the next page.
Power
Let’s look at the second component of social class: power.
The Democratic Facade. Like many people, you may have said to yourself, “The big
decisions are always made despite what I might think. Certainly I don’t make the deci-
sion to send soldiers to Afghanistan or Iraq. I don’t order drones into Pakistan. I don’t
decide to raise taxes, lower interest rates, or spend $700 billion to bail out Wall Street
fools and felons.”
And then another part of you may say, “But I do participate in these decisions
through my representatives in Congress, and by voting for president.” True enough—
as far as it goes. The trouble is, it just doesn’t go far enough. Such views of being a
TABLE 8.1 The Five Highest-Paid CEOs
Executive Company Compensation
Lawrence Ellison Oracle $95 million
Leslie Moonves CBS $59 million
Robert Iger Walt Disney $36 million
Mark Parker Nike $34 million
Philippe Dauman Viacom $33 million
Note: Compensation is for 2012. It includes salary, bonuses, and stock options.
Source: Thurm 2013.