
Page 303 - Essencials of Sociology
P. 303
276 CHAPTER 9 Race and Ethnicity
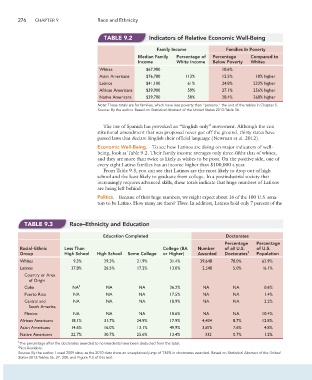
TABLE 9.2 Indicators of Relative Economic Well-Being
Family Income Families In Poverty
Median Family Percentage of Percentage Compared to
Income White Income Below Poverty Whites
Whites $67,900 10.6%
Asian Americans $76,700 113% 12.5% 18% higher
Latinos $41,100 61% 24.8% 233% higher
African Americans $39,900 59% 27.1% 256% higher
Native Americans $39,700 58% 28.4% 268% higher
Note: These totals are for families, which have less poverty than “persons,” the unit of the tables in Chapter 5.
Source: By the author. Based on Statistical Abstract of the United States 2013:Table 36.
The use of Spanish has provoked an “English-only” movement. Although the con-
stitutional amendment that was proposed never got off the ground, thirty states have
passed laws that declare English their official language (Newman et al. 2012).
Economic Well-Being. To see how Latinos are doing on major indicators of well-
being, look at Table 9.2. Their family income averages only three-fifths that of whites,
and they are more than twice as likely as whites to be poor. On the positive side, one of
every eight Latino families has an income higher than $100,000 a year.
From Table 9.3, you can see that Latinos are the most likely to drop out of high
school and the least likely to graduate from college. In a postindustrial society that
increasingly requires advanced skills, these totals indicate that huge numbers of Latinos
are being left behind.
Politics. Because of their huge numbers, we might expect about 16 of the 100 U.S. sena-
tors to be Latino. How many are there? Three. In addition, Latinos hold only 7 percent of the
TABLE 9.3 Race–Ethnicity and Education
Education Completed Doctorates
Percentage Percentage
Racial–Ethnic Less Than College (BA Number of all U.S. of U.S.
Group High School High School Some College or Higher) Awarded Doctorates 1 Population
Whites 9.3% 29.3% 21.9% 31.4% 39,648 78.0% 62.9%
Latinos 37.8% 26.5% 17.2% 13.0% 2,540 5.0% 16.1%
Country or Area
of Origin
Cuba NA 2 NA NA 26.2% NA NA 0.6%
Puerto Rico NA NA NA 17.5% NA NA 1.4%
Central and NA NA NA 18.9% NA NA 2.2%
South America
Mexico NA NA NA 10.6% NA NA 10.4%
African Americans 18.1% 31.7% 24.9% 17.9% 4,434 8.7% 12.8%
Asian Americans 14.6% 16.0% 13.1% 49.9% 3,875 7.6% 4.8%
Native Americans 22.7% 30.7% 25.6% 13.4% 332 0.7% 1.2%
1 The percentage after the doctorates awarded to nonresidents have been deducted from the total.
2 Not Available.
Source: By the author. I used 2009 data, as the 2010 data show an unexplained jump of 134% in doctorates awarded. Based on Statistical Abstract of the United
States 2013:Tables 36, 37, 300, and Figure 9.5 of this text.