
Page 299 - Essencials of Sociology
P. 299
272 CHAPTER 9 Race and Ethnicity
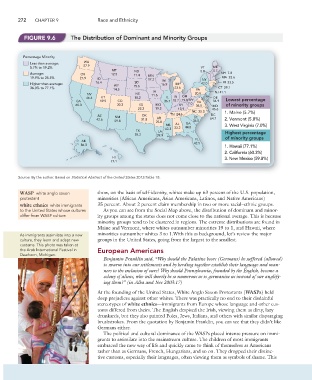
FIGURE 9.6 The Distribution of Dominant and Minority Groups
Percentage Minority
WA
Less than average:
5.7% to 19.2% 27.9 VT ME
MT ND 5.8 5.7
Average: OR 12.5 11.4 MN NH 7.8
19.9% to 35.5% 21.9 ID 17.2 WI NY MA 23.6
SD
Higher than average: 16.4 WY 15.6 16.9 MI 42.0 RI 23.5
e:
36.0% to 77.1% 23.6 CT 29.1
14.5 PA
IA NJ 41.1
NJ 41.1
NV NE 11.6 20.8
46.4 UT 18.2 IL IN OH DE E
CA 19.9 CO 36.7 18.7 19.0 WV VA 34.9 Lowest percentage
4.9
60.3 30.3 KS MO KY 7.0 35.5 MD D D D DD of minority groups
22.2 19.2 13.9 45.6.6
NC 35.0 1. Maine (5.7%)
TN 24.6 DC
AZ NM OK SC
42.6 31.8 AR 64.7 7 2. Vermont (5.8%)
59.8 25.8 36.0
MS AL GA 3. West Virginia (7.0%)
42.3 33.2 44.5
TX LA
55.2 39.9 Highest percentage
FL of minority groups
AK
36.3 42.5 1. Hawaii (77.1%)
2. California (60.3%)
HI 3. New Mexico (59.8%)
77.1
Source: By the author. Based on Statistical Abstract of the United States 2013:Table 18.
WASP white anglo saxon show, on the basis of self-identity, whites make up 63 percent of the U.S. population,
protestant minorities (African Americans, Asian Americans, Latinos, and Native Americans)
white ethnics white immigrants 35 percent. About 2 percent claim membership in two or more racial–ethnic groups.
to the United States whose cultures As you can see from the Social Map above, the distribution of dominant and minor-
differ from WASP culture ity groups among the states does not come close to the national average. This is because
minority groups tend to be clustered in regions. The extreme distributions are found in
Maine and Vermont, where whites outnumber minorities 19 to 1, and Hawaii, where
As immigrants assimilate into a new minorities outnumber whites 3 to 1.With this as background, let’s review the major
culture, they learn and adapt new groups in the United States, going from the largest to the smallest.
customs. This photo was taken at
the Arab International Festival in European Americans
Dearborn, Michigan.
Benjamin Franklin said, “Why should the Palatine boors (Germans) be suffered (allowed)
to swarm into our settlements and by herding together establish their language and man-
ners to the exclusion of ours? Why should Pennsylvania, founded by the English, become a
colony of aliens, who will shortly be so numerous as to germanize us instead of our anglify-
ing them?” (in Alba and Nee 2003:17)
At the founding of the United States, White Anglo Saxon Protestants (WASPs) held
deep prejudices against other whites. There was practically no end to their disdainful
stereotypes of white ethnics—immigrants from Europe whose language and other cus-
toms differed from theirs. The English despised the Irish, viewing them as dirty, lazy
drunkards, but they also painted Poles, Jews, Italians, and others with similar disparaging
brushstrokes. From the quotation by Benjamin Franklin, you can see that they didn’t like
Germans either.
The political and cultural dominance of the WASPs placed intense pressure on immi-
grants to assimilate into the mainstream culture. The children of most immigrants
embraced the new way of life and quickly came to think of themselves as Americans
rather than as Germans, French, Hungarians, and so on. They dropped their distinc-
tive customs, especially their languages, often viewing them as symbols of shame. This