
Page 298 - Essencials of Sociology
P. 298
Racial–Ethnic Relations in the United States 271
Summarize the major
Racial–Ethnic Relations in the patterns that characterize
9.5
United States European Americans, Latinos,
African Americans, Asian
Writing about race–ethnicity is like stepping onto a minefield: One never knows where to Americans, and Native Americans.
expect the next explosion. Serbian students have written to me, saying that I have
been unfair to their group. So have American whites. Even basic terms are con-
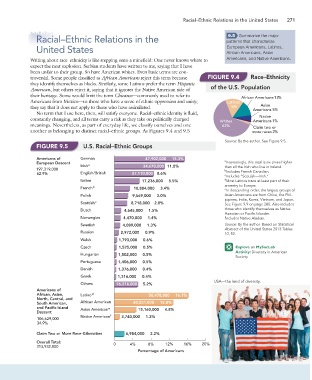
troversial. Some people classified as African Americans reject this term because FIGURE 9.4 Race–Ethnicity
they identify themselves as blacks. Similarly, some Latinos prefer the term Hispanic of the U.S. Population
American, but others reject it, saying that it ignores the Native American side of
their heritage. Some would limit the term Chicanos—commonly used to refer to
African Americans 13%
Americans from Mexico—to those who have a sense of ethnic oppression and unity; Latinos
they say that it does not apply to those who have assimilated. 16% Asian
Americans 5%
No term that I use here, then, will satisfy everyone. Racial–ethnic identity is fluid,
Native
constantly changing, and all terms carry a risk as they take on politically charged
Whites Americans 1%
meanings. Nevertheless, as part of everyday life, we classify ourselves and one 63% Claim two or
another as belonging to distinct racial–ethnic groups. As Figures 9.4 and 9.5 more races 2%
Source: By the author. See Figure 9.5.
FIGURE 9.5 U.S. Racial–Ethnic Groups
Americans of German 47,902,000 15.3%
European Descent a a Interestingly, this total is six times higher
Irish 34,670,000 11.0% than all the Irish who live in Ireland.
197,319,000 b Includes French Canadian.
62.9% English/British 27,110,000 8.6% c Includes “Scottish—Irish.”
Italian 17,236,000 5.5% d Most Latinos trace at least part of their
ancestry to Europe.
French b 10,804,000 3.4% e In descending order, the largest groups of
Polish 9,569,000 3.0% Asian Americans are from China, the Phil-
ippines, India, Korea, Vietnam, and Japan.
Scottish c 8,718,000 2.8% See Figure 9.9 on page 280. Also includes
Dutch 4,645,000 1.5% those who identify themselves as Native
Hawaiian or Pacific Islander.
Norwegian 4,470,000 1.4% f Includes Native Alaskan.
Swedish 4,089,000 1.3% Source: By the author. Based on Statistical
Abstract of the United States 2013:Tables
Russian 2,972,000 0.9% 10, 52.
Welsh 1,793,000 0.6%
Czech 1,525,000 0.5% Explore on MySocLab
Activity: Diversity in American
Hungarian 1,502,000 0.5%
Society
Portuguese 1,406,000 0.5%
Danish 1,376,000 0.4%
Greek 1,316,000 0.4%
USA—the land of diversity.
Others 16,216,000 5.2%
Americans of
African, Asian, Latino d 50,478,000 16.1%
North, Central, and
South American, African American 40,251,000 12.8%
and Pacific Island Asian American e 15,160,000 4.8%
Descent
Native American f 3,740,000 1.2%
106,629,000
34.9%
Claim Two or More Race–Ethnicities 6,984,000 2.2%
Overall Total: 0 4% 8% 12% 16% 20%
313,932,000
Percentage of Americans