
Page 341 - Essencials of Sociology
P. 341
314 CHAPTER 10 Gender and Age
TABLE 10.1 Rape Victims TABLE 10.2 Relationship of Victims and Rapists
Age Rate per 1,000 Females Relationship Percentage
12–15 1.6 Relative 6%
16–19 2.7 Known Well 33%
20–24 2.0 Casual Acquaintance 23%
25–34 1.3 Stranger 34%
35–49 0.8 Not Reported 3%
50–64 0.4 Sources: By the author. A ten-year average, based on Statistical Abstract of the United
65 and Older 0.1 States 2004:Table 323; 2005:Table 307; 2006:Table 311; 2007: Table 315; 2008:Table 316;
2009:Table 306; 2010:Table 306; 2011:Table 313; 2012:Table 317; 2013:Table 323.
Sources: By the author. A ten-year average, based on
Statistical Abstract of the United States 2004:Table 322;
2005:Table 306; 2006:Table 308; 2007:Table 311; 2008:
Table 313; 2009:Table 305; 2010:Table 305; 2011:Table
312; 2012:Table 316; 2013:Table 322.
Date (Acquaintance) Rape. What has shocked many about date rape (also known
as acquaintance rape) are studies showing how common it is (Littleton et al. 2008).
Researchers who used a nationally representative sample of women enrolled in U.S.
colleges and universities with 1,000 students or more found that 1.7 percent had
been raped during the preceding six months. Another 1.1 percent had been victims of
attempted rape (Fisher et al. 2000).
Think about how huge these numbers are. With 12 million women enrolled in col-
lege, 2.8 percent (1.7 plus 1.1) means that over a quarter of a million college women
were victims of rape or of attempted rape in just the past six months. (This conclusion
assumes that the rate is the same in colleges with fewer than 1,000 students, which has
not been verified.)
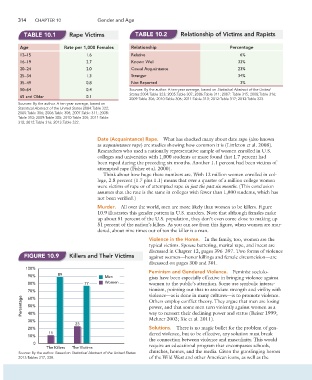
Murder. All over the world, men are more likely than women to be killers. Figure
10.9 illustrates this gender pattern in U.S. murders. Note that although females make
up about 51 percent of the U.S. population, they don’t even come close to making up
51 percent of the nation’s killers. As you can see from this figure, when women are mur-
dered, about nine times out of ten the killer is a man.
Violence in the Home. In the family, too, women are the
typical victims. Spouse battering, marital rape, and incest are
discussed in Chapter 12, pages 396–397. Two forms of violence
FIGURE 10.9 Killers and Their Victims against women—honor killings and female circumcision—are
discussed on pages 300 and 301.
100%
Feminism and Gendered Violence. Feminist sociolo-
90% 89 Men gists have been especially effective in bringing violence against
80% 77 Women women to the public’s attention. Some use symbolic interac-
70% tionism, pointing out that to associate strength and virility with
violence—as is done in many cultures—is to promote violence.
Percentage 50% Others employ conflict theory. They argue that men are losing
60%
power, and that some men turn violently against women as a
way to reassert their declining power and status (Reiser 1999;
40%
Meltzer 2002; Xie et al. 2011).
30%
23
20% Solutions. There is no magic bullet for the problem of gen-
11 dered violence, but to be effective, any solution must break
10%
the connection between violence and masculinity. This would
0
The Killers The Victims require an educational program that encompasses schools,
Source: By the author. Based on Statistical Abstract of the United States churches, homes, and the media. Given the gunslinging heroes
2013:Tables 317, 338. of the Wild West and other American icons, as well as the