
Page 336 - Essencials of Sociology
P. 336
Gender Inequality in the Workplace 309
shows that in 1890, about one of every five paid workers was a woman. By 1940, this
ratio had grown to one of four; by 1960 to one of three; and today, it is almost one of
two. As you can see from this figure, 53 percent of U.S. workers are men, and 47 per-
cent are women. During the next few years, we can expect little change in this ratio.
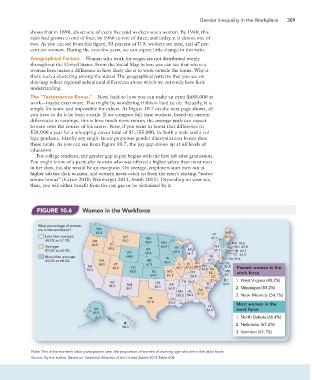
Geographical Factors. Women who work for wages are not distributed evenly
throughout the United States. From the Social Map below, you can see that where a
woman lives makes a difference in how likely she is to work outside the home. Why is
there such a clustering among the states? The geographical patterns that you see on
this map reflect regional subcultural differences about which we currently have little
understanding.
The “Testosterone Bonus.” Now, back to how you can make an extra $688,000 at
work—maybe even more. You might be wondering if this is hard to do. Actually, it is
simple for some and impossible for others. As Figure 10.7 on the next page shows, all
you have to do is be born a male. If we compare full-time workers, based on current
differences in earnings, this is how much more money the average male can expect
to earn over the course of his career. Now, if you want to boost that difference to
$28,900 a year for a whopping career total of $1,155,000, be both a male and a col-
lege graduate. Hardly any single factor pinpoints gender discrimination better than
these totals. As you can see from Figure 10.7, the pay gap shows up at all levels of
education.
For college students, the gender gap in pay begins with the first job after graduation.
You might know of a particular woman who was offered a higher salary than most men
in her class, but she would be an exception. On average, employers start men out at
higher salaries than women, and women never catch up from the men’s starting “testos-
terone bonus” (Carter 2010; Weinberger 2011; Smith 2012). Depending on your sex,
then, you will either benefit from the pay gap or be victimized by it.
FIGURE 10.6 Women in the Workforce
What percentage of women
are in the workforce? WA
62.4 ME
VT
Less than average: e: MT ND 67.1 61.0
48.2% to 57.1% OR 59.2 68.4
60.8 ID MN NH 65.6
Average: 58.2 66.9 WI NY MA 62.0
57.2% to 62.1% SD 65.6 MI 57.1 RI 63.7
WY 66.8 56.7 CT 62.8
More than average: 64.8 IA PA NJ 59.6
e:
NJ 59.6
62.4% to 68.4% NV NE 66.6 57.1
58.0 UT 67.2 IL IN OH DE E
CA CO 60.3 WV 56.8 .8
57.0 60.2 60.1 57.9 48.2 VA Fewest women in the
63.0 KS MO KY 62.1 MD D work force
64.0 61.1 56.1 NC 63.1 .1
AZ OK TN 56.3 SC 57.4 DC 1. West Virginia (48.2%)
56.3 NM 56.2 AR 64.4 4
54.1 54.9 GA 55.2 2. Mississippi (53.2%)
MS AL
53.2 54.3 57.2 3. New Mexico (54.1%)
TX LA
57.4 55.9
FL Most women in the
AK 56.0 work force
65.3
1. North Dakota (68.4%)
HI
58.3 2. Nebraska (67.2%)
3. Vermont (67.1%)
Note: This is the women’s labor participation rate, the proportion of women of working age who are in the labor force.
Source: By the author. Based on Statistical Abstract of the United States 2013:Table 604.