
Page 334 - Essencials of Sociology
P. 334
Gender Inequality in the United States 307
Down-to-Earth Sociology
Affirmative Action for Men?
he idea that we might need affirmative action for men yet knows the reasons for this—and there are a lot of sugges-
was first proposed by psychologist Judith Kleinfeld tions being thrown around—some have begun to consider
T(2002). Many met this suggestion with laughter. After the imbalance a problem searching for a solution. To get
all, men dominate societies around the world, and they have closer to a male–female balance, some colleges have begun
done so for millennia. To think that to reject more highly qualified
men would ever need affirmative women (Kingsbury 2007). And
action seemed humorous at best. to help men adjust to their new
But let’s pause, step back, and minority status, Clark University in
try to see whether the idea has Massachusetts has begun a men’s
any merit. Look again at Figures support program (Gibbs 2008).
10.2 and 10.3 on pages 306. Do Metropolitan Community College
you see that women have not in Kansas City is following suit,
only caught up with men but have setting up study groups for men,
passed them by? Do you see that mentoring programs for men,
this applies to all racial–ethnic and students associations for men
groups? This is not a temporary (Rosin 2010).
situation, like lead cars changing
place at the Indy 500. For de-
cades, women have been adding For Your Consideration
to their share of college enroll- With fewer men than women in college, is it time to
ment and the degrees they earn. consider affirmative action for men? ↑ Why do you think that men
With colleges open to both have fallen behind? What implica-
women and men, why don’t enrollment and degree totals tions could this have for the future of society? Do you think
match the relative proportions of women and men in the anything should be done about this imbalance? If so, why?
population (51 percent and 49 percent)? Although no one And if so, what?
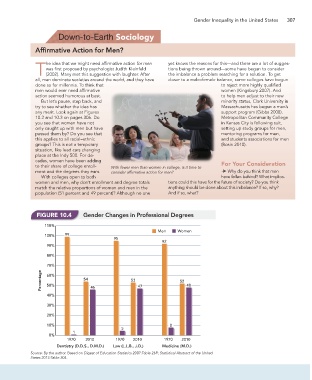
FIGURE 10.4 Gender Changes in Professional Degrees
110%
Men Women
100% 99
95
92
90%
80%
70%
Percentage 60% 54 46 53 47 52 48
50%
40%
30%
20%
10% 8
5
1
0%
1970 2010 1970 2010 1970 2010
Dentistry (D.D.S., D.M.D.) Law (L.L.B., J.D.) Medicine (M.D.)
Source: By the author. Based on Digest of Education Statistics 2007:Table 269; Statistical Abstract of the United
States 2013:Table 304.