
Page 335 - Essencials of Sociology
P. 335
308 CHAPTER 10 Gender and Age
degrees. The greatest change is in dentistry: In 1970, across the entire United States, only
34 women earned degrees in dentistry. Today, that total has jumped to 2,300 a year. As you
can also see, almost as many women as men now become dentists, lawyers, and physicians.
It is likely that women will soon outnumber men in earning these professional degrees.
Gender Tracking. With such extensive change, it would seem that gender equality has
been achieved, or at least almost so. In some instances—as with the changed sex ratio in
college—we even have a new form of gender inequality. If we look closer, however, we
can see gender tracking. That is, college degrees tend to follow gender, which reinforces
male–female distinctions. Here are two extremes: Men earn 94 percent of the associ-
ate’s degrees in the “masculine” field of construction trades, while women are awarded
95 percent of the associate’s degrees in the “feminine” field of “family and consumer
sciences” (Statistical Abstract 2013:Table 302). Because gender socialization gives men
and women different orientations to life, they enter college with gender-linked aspi-
rations. Socialization—not some presumed innate characteristic—channels men and
women into different educational paths.
Gender Inequality in the Workplace
Explain reasons for the
10.4
pay gap; discuss the glass ceiling
To examine the work setting is to make visible basic relations between men and women.
and sexual harassment.
Let’s begin with one of the most remarkable areas of gender inequality at work, the pay gap.
The Pay Gap
After college, you might like to take a few years off, travel around Europe, sail the oceans,
or maybe sit on a beach in some South American paradise and drink piña coladas. But
chances are, you are going to go to work instead. Since you have to work, how would you
like to make an extra $688,000 on your job? If this sounds appealing, read on. I’m going
to reveal how you can make an extra $1,435 a month between the ages of 25 and 65.
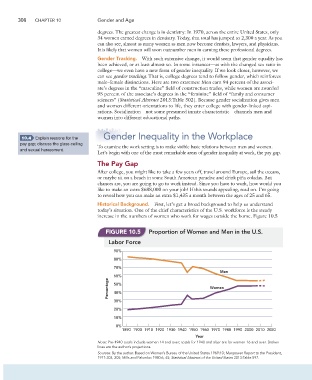
Historical Background. First, let’s get a broad background to help us understand
today’s situation. One of the chief characteristics of the U.S. workforce is the steady
increase in the numbers of women who work for wages outside the home. Figure 10.5
FIGURE 10.5 Proportion of Women and Men in the U.S.
Labor Force
90%
80%
70%
Men
60%
Percentage 50% Women
40%
30%
20%
10%
0%
1890 1900 1910 1920 1930 1940 1950 1960 1970 1980 1990 2000 2010 2020
Year
Note: Pre-1940 totals include women 14 and over; totals for 1940 and after are for women 16 and over. Broken
lines are the author’s projections.
Sources: By the author. Based on Women’s Bureau of the United States 1969:10; Manpower Report to the President,
1971:203, 205; Mills and Palumbo 1980:6, 45; Statistical Abstract of the United States 2013:Table 597.