
Page 333 - Essencials of Sociology
P. 333
306 CHAPTER 10 Gender and Age
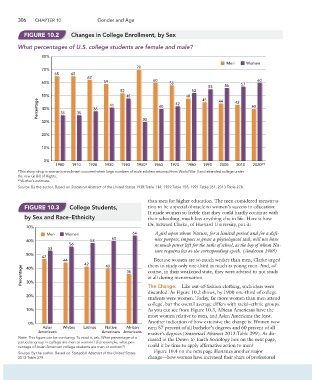
FIGURE 10.2 Changes in College Enrollment, by Sex
What percentages of U.S. college students are female and male?
80%
Men Women
70
70%
65 65
62
60% 59 60 58 57 60
55 56
52 52
50% 48 48 45 44
Percentage 40% 35 35 38 41 40 42 43 40
30% 30
20%
10%
0%
1900 1910 1920 1930 1940 1950* 1960 1970 1980 1990 2000 2010 2020**
*This sharp drop in women’s enrollment occurred when large numbers of male soldiers returned from World War II and attended college under
the new GI Bill of Rights.
**Author’s estimate.
Source: By the author. Based on Statistical Abstract of the United States 1938:Table 114; 1959:Table 158; 1991:Table 261; 2013:Table 278.
than men for higher education. The men considered menstrua-
FIGURE 10.3 College Students, tion to be a special obstacle to women’s success in education:
It made women so feeble that they could hardly continue with
by Sex and Race–Ethnicity their schooling, much less anything else in life. Here is how
Dr. Edward Clarke, of Harvard University, put it:
70%
Men Women 64 A girl upon whom Nature, for a limited period and for a defi-
60 nite purpose, imposes so great a physiological task, will not have
60% 58
56 as much power left for the tasks of school, as the boy of whom Na-
53
ture requires less at the corresponding epoch. (Andersen 1988)
50%
47
44 Because women are so much weaker than men, Clarke urged
42 40 them to study only one-third as much as young men. And, of
Percentage 36 course, in their weakened state, they were advised to not study
40%
at all during menstruation.
30%
The Change. Like out-of-fashion clothing, such ideas were
discarded. As Figure 10.2 shows, by 1900 one-third of college
20%
students were women. Today, far more women than men attend
college, but the overall average differs with racial–ethnic groups.
10% As you can see from Figure 10.3, African Americans have the
most women relative to men, and Asian Americans the least.
0% Another indication of how extensive the change is: Women now
Asian Whites Latinos Native African earn 57 percent of all bachelor’s degrees and 60 percent of all
Americans Americans Americans master’s degrees (Statistical Abstract 2013:Table 299). As dis-
Note: This figure can be confusing. To read it, ask, What percentage of a cussed in the Down-to-Earth Sociology box on the next page,
particular group in college are men or women? (For example, what per-
centage of Asian American college students are men or women?) could it be time to apply affirmative action to men?
Figure 10.4 on the next page illustrates another major
Source: By the author. Based on Statistical Abstract of the United States
2013:Table 279. change—how women have increased their share of professional